| B | C | D | E | F | G | |
|---|---|---|---|---|---|---|
| 9 | 2021 | 2022 | 2023 | 2024 | 2025 | |
| 19 | Organic revenue growth | 20.0% | 19.2% | 22.7% | 18.8% | |
| 39 | Adjusted EBITDA margin | 28.8% | 26.7% | 28.8% | 32.2% | 33.9% |
| 59 | FCF / Adjusted EBITDA | (2.3%) | 61.9% | 74.6% | 47.4% | 66.2% |
| 107 | Net debt / Adjusted EBITDA (x) | (2.8x) | (2.5x) | (2.5x) | (1.6x) | 2.9x |
| 99 | ROIC, adjusted | 61.5% | 55.2% | 64.2% | 11.4% |
You are the associate on a private equity team that covers financial software. Permira and Warburg Pincus agreed on December 20, 2025 to take Clearwater Analytics (NYSE: CWAN) private at $24.55 a share, about $8.4 billion of transaction value. The deal closed in June 2026, and it is now the reference point for the next vertical software take-private your partner will look at.
Your job is to read Clearwater’s own statements, five years of them, and say what they support at that price. This page takes the analysis one step at a time, each step run in Compound on the 10-Ks and the latest 10-Q. The answer at the end: the growth holds up, but at $24.55 the buyers get a thin cash return today and pay for growth to come. Figures in the text are rounded, in $M. The tables show Compound’s exact figures.
Financial statement analysis is the read of the three statements together. The income statement shows revenue, costs and profit for a period. The balance sheet shows what the company owns and owes on one date. The cash flow statement shows the cash that came in and went out. Ratios join them: a margin divides one income statement line by revenue, a return divides profit by the capital on the balance sheet, and cash conversion divides cash flow by profit.
How to analyze financial statements: spread the three statements first
The first step puts five years of statements into one workbook, as reported, and proves that every total ties.
“Spread [company]'s income statement, balance sheet and cash flow statement for the last five fiscal years from its 10-Ks, plus the latest 10-Q, citing every figure to its filing and printed page. Build the totals as formulas, tie them to the reported figures, and rebuild adjusted EBITDA from the company's own reconciliation.”
Compound read the FY2022, FY2023 and FY2025 10-Ks and the Q3 2025 10-Q. Each hard-coded figure in the IS, BS and CFS tabs cites its document and page. Every total is a live formula. The balance sheet balances, the cash flow statement ends on the balance sheet’s cash, and adjusted EBITDA rebuilt from net income matches the company’s figure in every year.
| B | C | D | E | F | G | |
|---|---|---|---|---|---|---|
| 6 | 2021 | 2022 | 2023 | 2024 | 2025 | |
| 9 | Revenue ($M) | 252.0 | 303.4 | 368.2 | 451.8 | 731.4 |
| 11 | Gross profit ($M) | 184.2 | 215.6 | 261.0 | 328.8 | 492.1 |
| 15 | Total operating expenses ($M) | (155.7) | (210.5) | (277.8) | (316.6) | (499.8) |
| 16 | Income (loss) from operations ($M) | 28.5 | 5.1 | (16.7) | 12.2 | (7.7) |
| 23 | Net income (loss) ($M) | (8.1) | (6.7) | (23.1) | 427.61 | (40.3) |
| 34 | Total equity-based compensation ($M) | 36.7 | 65.7 | 104.4 | 103.2 | 127.9 |
| 49 | Adjusted EBITDA ($M) | 72.7 | 81.1 | 105.9 | 145.7 | 248.2 |
| 51 | Adjusted EBITDA, as reported | 72.7 | 81.1 | 105.9 | 145.7 | 248.2 |
| 52 | Difference | – | – | – | – | –2 |
- 1FY2024 net income includes a one-off tax benefit when the valuation allowance on deferred tax assets was released
- 2Adjusted EBITDA rebuilt from net income matches the company's reconciliation in every year
The spread already shows the shape of the business. Revenue nearly tripled in four years, a 30.5% compound annual growth rate. Operating income stayed near zero the whole time, and the one year of large net income, FY2024, came from a tax benefit, not from operations.
Takeaway: the statements tie, so every ratio below rests on figures you can trace to a page. The first question is how much of the growth was bought.
Revenue growth analysis: organic against acquired
The second step splits 2025’s growth into the business Clearwater had and the businesses it bought.
Clearwater bought Enfusion on April 21, 2025 and Beacon nine days later. The 10-K’s acquisition note discloses what each contributed: $158.9M and $35.6M of 2025 revenue. Compound subtracted both.
| B | F | G | |
|---|---|---|---|
| 9 | 2024 | 2025 | |
| 12 | Revenue ($M) | 451.8 | 731.4 |
| 13 | % growth | 22.7% | 61.9%1 |
| 17 | Acquired revenue, disclosed ($M) | – | 194.5 |
| 18 | Organic revenue ($M) | 451.8 | 536.9 |
| 19 | Organic revenue growth | 22.7% | 18.8%2 |
| 21 | Pro forma revenue (Enfusion and Beacon from 1-Jan-2024) | 708.3 | 817.0 |
| 22 | Pro forma revenue growth | 15.4%3 | |
| 23 | Annualized recurring revenue, period end ($M) | 474.9 | 841.0 |
| 25 | Acquired ARR (acquired entities) | 282.0 | |
| 26 | Organic ARR ($M) | 559.0 | |
| 27 | Organic ARR growth | 17.7% |
- 1Reported growth: 43 of the 62 points are Enfusion and Beacon
- 2Organic: revenue less the disclosed acquired revenue, over prior-year revenue
- 3Pro forma: both businesses in both years. Growth of the combined company
Clearwater's 2025 growth depends on what you count
Growth in 2025 on four bases, from the same 10-K
Source: Clearwater 10-K FY2025 pp. 47, 85-87. Calculation by Compound, Analysis tab.
Organic revenue grew 18.8%, down from 22.7% in 2024. Organic annualized recurring revenue (ARR) grew 17.7% in the year to December. The earnings call analysis page’s 17.0% is the year to September, so the two agree. Retention backs the organic figure: gross revenue retention has been 98% in every year, and net revenue retention was 113% excluding the acquired businesses. Pro forma growth, 15.4%, is the rate of the business a buyer now owns, since Enfusion grows more slowly than Clearwater’s core: about 13% on its third-quarter run rate.
Takeaway: organic growth is high-teens and backed by retention, but the combined company grew 15.4%, not 61.9%. The next question is whether that growth earns a profit.
Profitability ratios: adjusted EBITDA margin after stock pay
The third step sets the company’s adjusted margin against the costs it adds back.
Adjusted EBITDA is the company’s own profit measure. Clearwater’s adds back interest, taxes, depreciation and amortization, and also stock-based compensation, its payroll taxes and transaction costs. Stock pay is the largest of those add-backs, and it is a real cost: shareholders bear it through dilution, and a private owner has to replace it with cash or an equity pool.
| B | C | D | E | F | G | |
|---|---|---|---|---|---|---|
| 9 | 2021 | 2022 | 2023 | 2024 | 2025 | |
| 33 | Gross margin | 73.1% | 71.1% | 70.9% | 72.8% | 67.3%1 |
| 37 | Operating margin (GAAP) | 11.3% | 1.7% | (4.5%) | 2.7% | (1.1%) |
| 38 | Adjusted EBITDA ($M) | 72.7 | 81.1 | 105.9 | 145.7 | 248.2 |
| 39 | Adjusted EBITDA margin | 28.8% | 26.7% | 28.8% | 32.2% | 33.9% |
| 44 | Equity-based compensation ($M) | 36.7 | 65.7 | 104.4 | 103.2 | 127.9 |
| 45 | % of revenue | 14.6% | 21.6% | 28.4% | 22.8% | 17.5% |
| 46 | SBC and related payroll taxes, Adj. EBITDA add-back ($M) | 36.7 | 66.5 | 108.1 | 111.0 | 134.5 |
| 47 | % of revenue | 14.6% | 21.9% | 29.4% | 24.6% | 18.4% |
| 48 | Adjusted EBITDA less SBC and payroll taxes ($M) | 36.0 | 14.6 | (2.2) | 34.7 | 113.7 |
| 49 | % margin | 14.3% | 4.8% | (0.6%) | 7.7% | 15.5%2 |
- 1Gross margin fell 5.5 points in the year Enfusion and Beacon came in
- 2After stock pay and its payroll taxes, less than half the adjusted margin is left
Clearwater's margin on three definitions
Percentage of revenue, FY2021 to FY2025
Source: Clearwater 10-K FY2025, FY2023 and FY2022. Calculation by Compound, Analysis tab.
The adjusted margin rose five points, from 28.8% to 33.9%. Stock pay peaked at 28.4% of revenue in 2023 and fell to 17.5% in 2025, which is real progress. Even so, adjusted EBITDA after stock pay and its payroll taxes is $113.7M, a 15.5% margin, and the GAAP operating margin is still below zero. The gap between the adjusted and GAAP lines is mostly stock pay, then the amortization of what Clearwater bought and the deal costs.
Takeaway: the adjusted margin rose, but GAAP profit did not, and charging stock pay halves the margin. The next question is how much of the profit turns into cash.
Cash flow analysis: how much EBITDA turns into cash
The fourth step measures free cash flow against adjusted EBITDA, with and without the cash Clearwater spends on its own stock awards.
| B | C | D | E | F | G | |
|---|---|---|---|---|---|---|
| 9 | 2021 | 2022 | 2023 | 2024 | 2025 | |
| 54 | Cash from operations ($M) | 3.4 | 58.0 | 84.6 | 74.3 | 175.9 |
| 55 | Purchases of property, equipment and software | (5.0) | (7.8) | (5.6) | (5.3) | (11.6) |
| 56 | Free cash flow ($M) | (1.7) | 50.2 | 79.0 | 69.1 | 164.3 |
| 57 | FCF margin | (0.7%) | 16.6% | 21.5% | 15.3% | 22.5% |
| 59 | FCF / Adjusted EBITDA | (2.3%) | 61.9% | 74.6% | 47.4%1 | 66.2% |
| 50 | Taxes paid on net share settlement | 2.2 | 3.2 | 20.8 | 55.3 | 33.7 |
| 60 | FCF less taxes on net share settlement ($M) | (3.9) | 47.1 | 58.2 | 13.8 | 130.6 |
| 61 | % of Adjusted EBITDA | (5.3%) | 58.0% | 54.9% | 9.4% | 52.6%2 |
| 63 | TRA payments within CFO (expense less liability change) | – | (0.6) | 8.4 | 72.0 | 0.0 |
| 64 | CFO before TRA payments / Adjusted EBITDA | 4.6% | 70.8% | 87.8% | 100.5% | 70.9% |
| 68 | Days sales outstanding (AR / revenue) | 73 | 87 | 91 | 86 | 843 |
| 69 | DSO on pro forma revenue | 75 |
- 1FY2024 cash flow carried $72.0M of payments under the tax receivable agreement, which settled that year. Before them, cash from operations was 100.5% of adjusted EBITDA
- 2Paying the tax on vesting awards in cash cuts conversion to 53%
- 384 days is inflated by the acquisitions closed in April. On full-year pro forma revenue it is 75
Free cash flow was $164.3M in 2025, 66% of adjusted EBITDA. Capex is light, 1.6% of revenue, as it usually is for software. The deduction to watch sits in financing cash flow: when employees’ awards vest, Clearwater withholds shares and pays their tax in cash, $33.7M in 2025. That is stock pay coming back as a cash cost, and after it conversion falls to 53%.
Takeaway: cash conversion is solid, not exceptional, at 66% of adjusted EBITDA and 53% after the tax on vesting awards. The next question is what Clearwater spent its cash and its stock on.
Balance sheet analysis: what the 2025 acquisitions added
The fifth step reads the acquisition note to see what Enfusion and Beacon cost and where that cost now sits on the balance sheet.
| B | C | D | E | |
|---|---|---|---|---|
| 5 | Enfusion | Beacon | Total | |
| 9 | Cash paid | 760.5 | 351.3 | 1,111.8 |
| 10 | Fair value of CWAN Class A stock issued | 598.6 | 178.7 | 777.4 |
| 11 | Converted equity awards (pre-combination service) | 12.8 | 1.9 | 14.7 |
| 12 | Payment to terminate Enfusion tax receivable agreement | 30.0 | 30.0 | |
| 13 | Total consideration ($M) | 1,401.9 | 531.9 | 1,933.9 |
| 14 | Less: cash acquired | (22.9) | (44.2) | (67.1) |
| 15 | Consideration, net of cash acquired ($M) | 1,379.1 | 487.7 | 1,866.8 |
| 17 | Issue price per CWAN share ($) | $21.331 | $22.74 | |
| 20 | Goodwill | 854.4 | 339.2 | 1,193.6 |
| 24 | Identified intangible assets ($M) | 450.0 | 166.9 | 616.9 |
| 26 | Goodwill and intangibles % of net consideration | 94.6% | 103.8% | 97.0%2 |
| 37 | FY2025 revenue contributed ($M) | 158.9 | 35.6 | 194.5 |
| 43 | FY2024 standalone revenue | 201.6 | ||
| 45 | Net consideration / FY2024 revenue (x) | 6.8x3 |
- 1Shares issued to Enfusion holders at $21.33. The take-private paid $24.55, 15.1% more, eight months later
- 297% of what Clearwater paid is goodwill and intangibles
- 3Enfusion's price over its revenue in the year before the deal
The two deals cost $1.87B net of cash acquired: $1.11B in cash, mostly borrowed, and $777M in new Clearwater shares. Enfusion alone was 6.8x its 2024 revenue. Almost all of the price went to goodwill and intangible assets, which are now 64.6% of Clearwater’s total assets. Amortization of those intangibles rose to $75.7M in 2025, and the 10-K schedules $106.1M for 2026, a cost that keeps GAAP profit low for years.
Takeaway: the 2025 deals rebuilt the balance sheet around goodwill. The next question is what they did to leverage and to the return on capital.
Leverage ratios and return on invested capital
The sixth step reads the debt the deals added and the return Clearwater now earns on everything it has invested.
| B | C | D | E | F | G | |
|---|---|---|---|---|---|---|
| 9 | 2021 | 2022 | 2023 | 2024 | 2025 | |
| 96 | Invested capital, excl. cash and DTA ($M) | 61.2 | 134.0 | 140.5 | 187.9 | 2,066.5 |
| 99 | ROIC, adjusted | 61.5% | 55.2% | 64.2% | 11.4%1 | |
| 100 | Goodwill and intangible assets | – | 73.2 | 71.5 | 101.8 | 1,957.6 |
| 104 | Total debt, carrying value ($M) | 53.9 | 51.2 | 48.6 | 45.9 | 822.6 |
| 105 | Cash and investments | 254.6 | 255.6 | 317.7 | 285.8 | 91.2 |
| 106 | Net debt (cash) ($M) | (200.7) | (204.4) | (269.1) | (239.9) | 731.4 |
| 107 | Net debt / Adjusted EBITDA (x) | (2.8x) | (2.5x) | (2.5x) | (1.6x) | 2.9x2 |
| 109 | Adjusted EBITDA / interest expense (x) | 2.8x | n.m. | 22.4x | 33.7x | 5.4x |
| 112 | Liquidity: cash, investments and undrawn revolver ($M) | 247.2 |
- 1Adjusted ROIC: (adjusted EBITDA less D&A) taxed at 21%, over average invested capital. Excluding goodwill and intangibles it is still 131.9%
- 2Net debt of $731.4M against $248.2M of adjusted EBITDA
At the end of 2024 Clearwater held $239.9M more cash than debt. A year later it owed $731.4M net, 2.9x adjusted EBITDA, and interest coverage had fallen from 33.7x to 5.4x. Liquidity is $247.2M, cash plus an undrawn $156M revolver. Return on invested capital tells the same story from the other side. On the capital it ran with before the deals, Clearwater earned over 60% a year. On the $2.07B it has invested now, it earns 11.4%. The core business still earns very high returns on its tangible capital. What fell is the return on what Clearwater paid for Enfusion and Beacon, which now depends on the integration delivering.
Takeaway: net cash became 2.9x leverage, and the return on capital fell from 64.2% to 11.4%. The last question is what all of this says about $24.55.
Financial ratio analysis against the $24.55 price
The last step sets the statements against the price the buyers paid.
| B | G | |
|---|---|---|
| 9 | 2025 | |
| 115 | Offer price per share ($) | $24.55 |
| 116 | Transaction value ($M) | 8,400.0 |
| 117 | Transaction value / FY2025 revenue (x) | 11.5x |
| 118 | Transaction value / FY2025 pro forma revenue (x) | 10.3x |
| 119 | Transaction value / Adjusted EBITDA (x) | 33.8x |
| 120 | Transaction value / (Adj. EBITDA less SBC) (x) | 73.9x1 |
| 121 | FCF yield on transaction value | 2.0%2 |
| 122 | Enfusion share issue price, 21-Apr-2025 ($) | $21.33 |
| 123 | Beacon share issue price, 30-Apr-2025 ($) | $22.74 |
| 124 | Offer premium to Enfusion issue price | 15.1% |
| 125 | Offer premium to Beacon issue price | 8.0% |
- 1Adjusted EBITDA less SBC and its payroll taxes, $113.7M
- 2$164.3M of 2025 free cash flow on $8.4B
On 2025’s actual results, the price is 33.8x adjusted EBITDA and 73.9x once stock pay and its payroll taxes are charged. The free cash flow yield is 2.0%. On management’s 2026 plan, as the valuation page shows, the same price is 24.9x EBITDA, so most of the multiple is paid for growth still to come. One more ratio is easy to miss. Clearwater issued shares to Enfusion’s holders at $21.33 and to Beacon’s at $22.74 in April 2025. The offer is only 15.1% and 8.0% above those prices, so the sellers of both businesses got close to the take-private price for their stock.
Organic growth intact
18.8%
Margin after stock pay
15.5%
Cash yield at the offer
2.0%
Leverage after the deals
2.9x
Takeaway: the statements support the growth, but at $24.55 the buyers get a 2.0% cash yield today and pay for the plan, which is where the DCF model page picks up.
Compound put the five findings on one page, each with how it bears on the price.
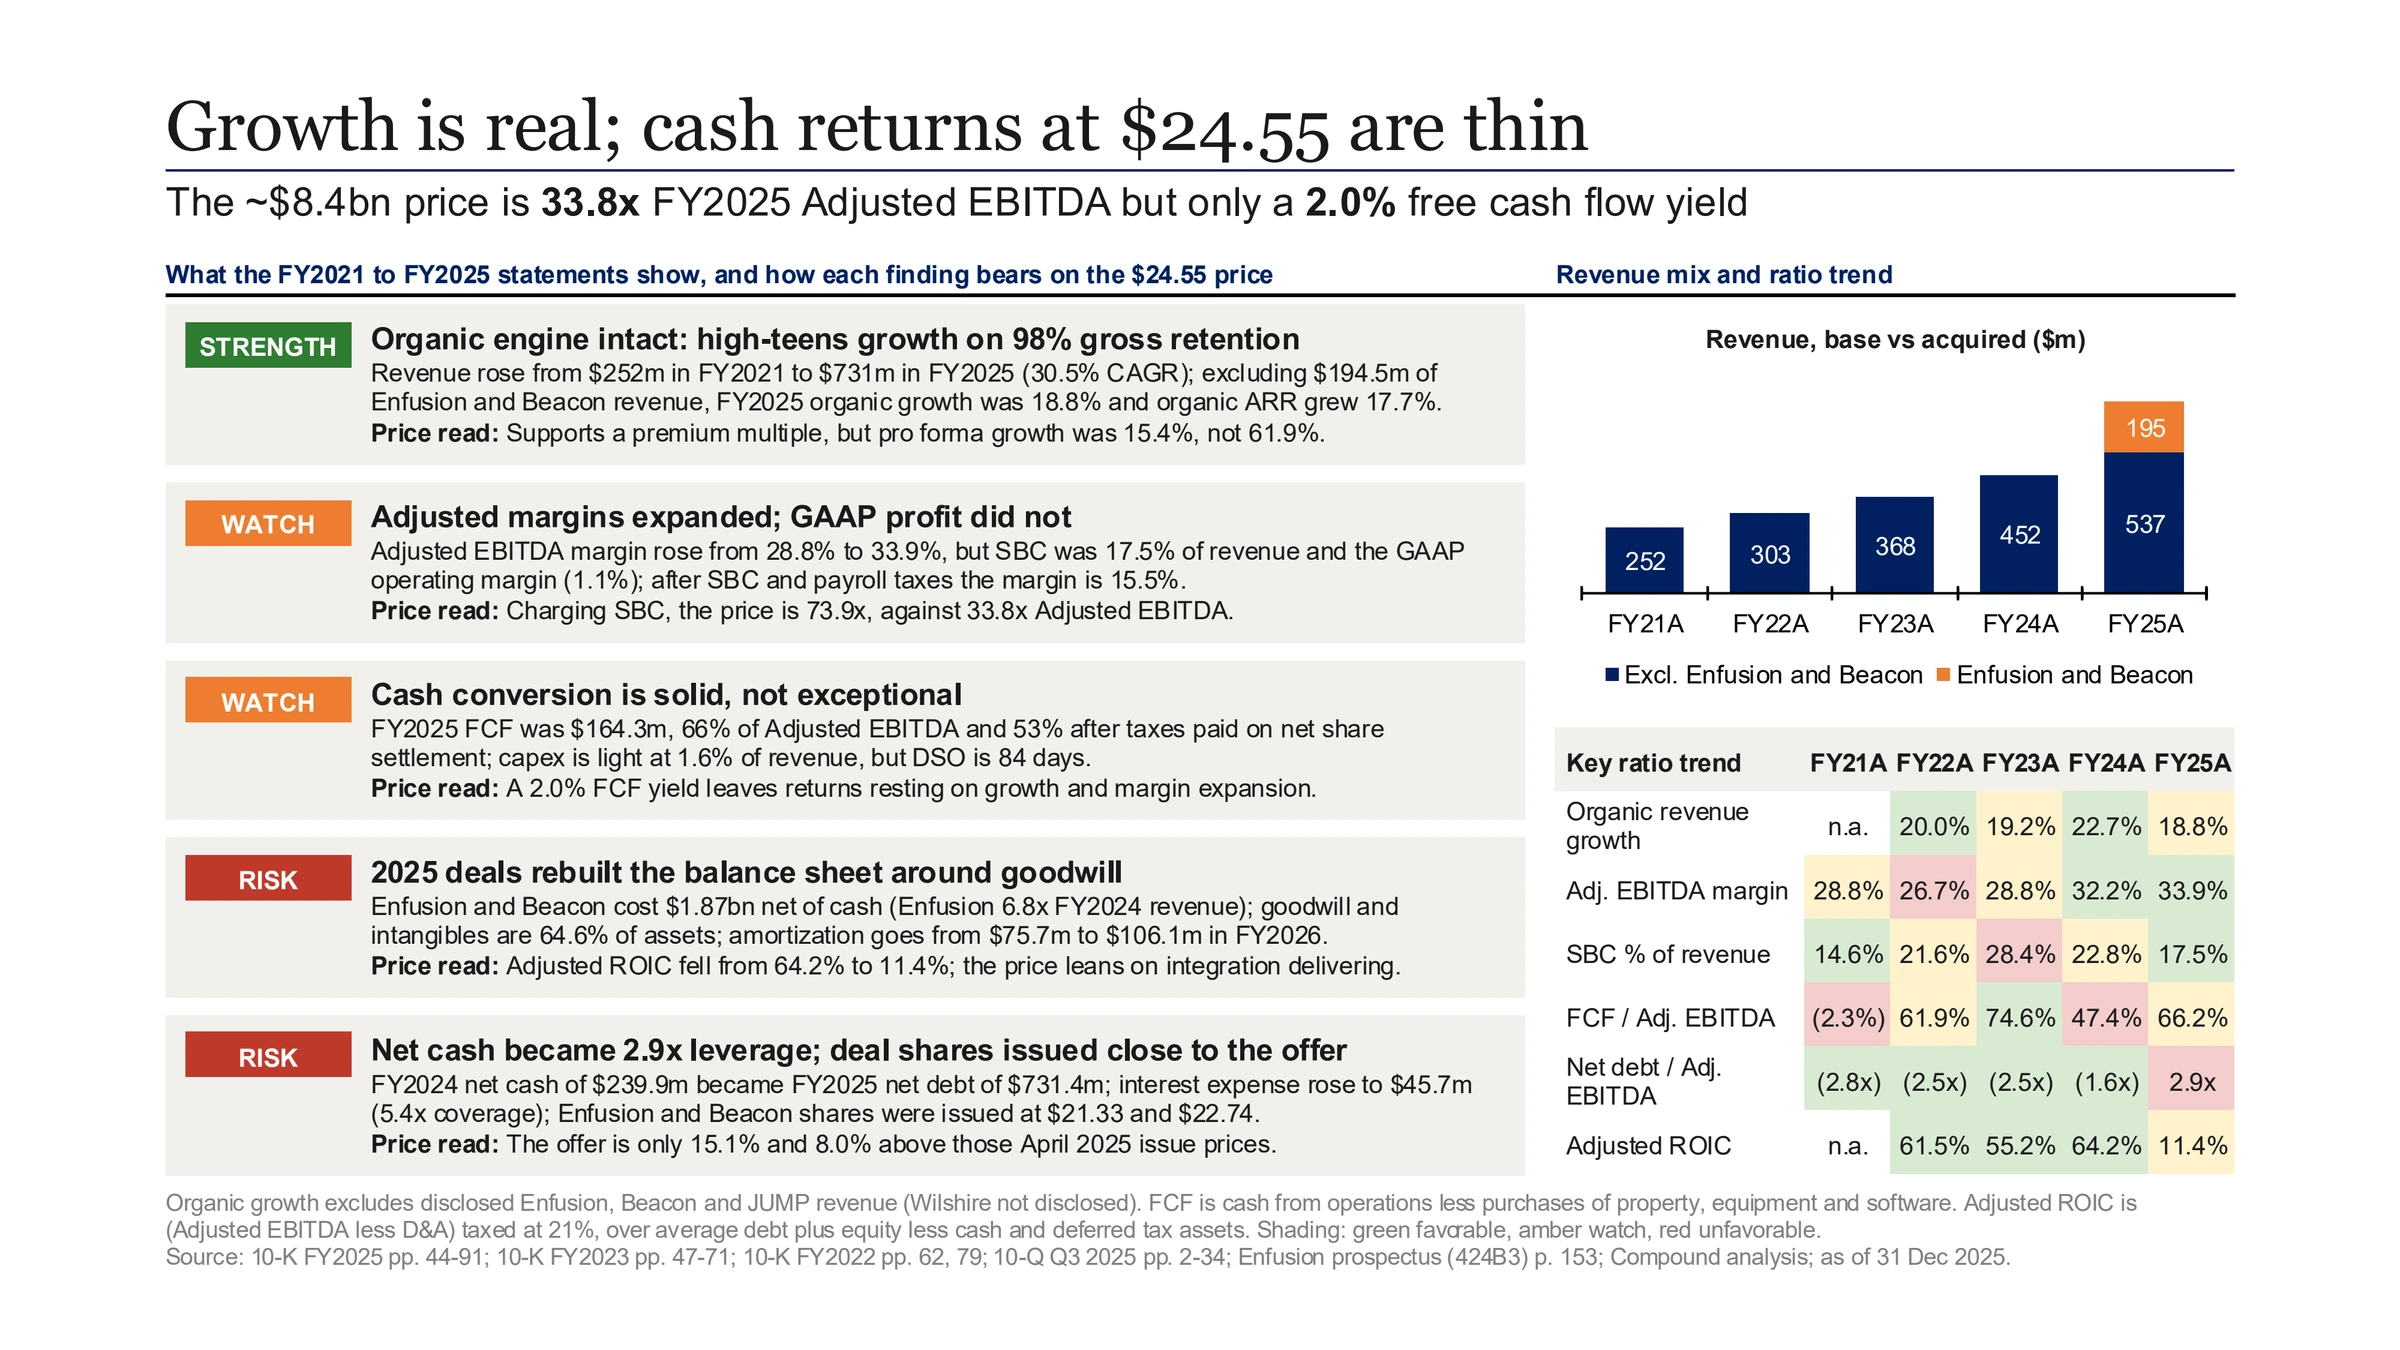
The organic growth rate and the margin after stock pay feed the DCF model and the earnings call analysis, which tests how far management’s plan runs ahead of this record.
Financial statement analysis workbook (Excel)Compound’s workbook from this run, free and without a form: the IS, BS and CFS tabs as reported for FY2021 to FY2025 plus Q3 and LTM, each figure cited to its filing and page, the Analysis tab of ratios and trends, and the Acquisitions tab. It also holds what this page leaves out: operating expense ratios, working capital days, capitalized software and the LTM column. Use it as a financial ratio analysis template: replace the statements with your company’s and the ratios recalculate.Download · Free, no form One-page findings slide (PowerPoint)Compound’s findings page for Clearwater: five findings with their price read, the base and acquired revenue chart and the heat-shaded ratio table.Download · Free, no formFAQ
What are the main financial ratios?
Five groups cover most of the work. Growth: reported, organic and pro forma revenue growth. Profitability: gross, operating and EBITDA margins. Cash conversion: free cash flow over EBITDA and working capital days such as DSO. Leverage and liquidity: net debt over EBITDA, interest coverage and the current ratio. Returns: return on invested capital or on equity. For a buyer, the ratios that move the price are usually organic growth, margin after stock pay, cash conversion and leverage.
What is the difference between ratio analysis, trend analysis and common-size analysis?
Ratio analysis divides one line by another to compare businesses of different sizes, such as EBITDA over revenue. Trend analysis, also called horizontal analysis, follows a line or ratio across periods. Common-size analysis, or vertical analysis, states every line as a percentage of revenue or of total assets. Most financial statement analysis uses all three, as the Analysis tab here does: the margins are common-size lines, and the five-year columns are the trend.
How do you separate organic growth from acquired growth?
Start from the acquisition note in the 10-K, which usually discloses the revenue each acquired business contributed since closing. Subtract it from reported revenue and divide by last year’s revenue. Then check against pro forma revenue, which the same note often gives as if the deal had closed at the start of the prior year, and against organic ARR if the company reports it. Where a contribution is not disclosed, as for Clearwater’s 2024 Wilshire deal, say so rather than estimate it.
Should adjusted EBITDA add back stock-based compensation?
Companies add it back, and market multiples are usually quoted that way, but a buyer should show both. Stock pay is pay: shareholders bear it through dilution, and a private owner bears it in cash. Clearwater’s adjusted margin of 33.9% becomes 15.5% once stock pay and its payroll taxes are charged. The DCF model page shows what that choice does to value per share.
Can Compound analyze financial statements from 10-Ks and 10-Qs?
Yes. Compound reads the filings, including the notes, and spreads the income statement, balance sheet and cash flow statement into Excel with every figure cited to its document and page. Totals are live formulas that tie to the reported figures, and the ratios and trends are formulas you can audit and extend. It works on several companies at once for a comparison, and on private company accounts in PDF.