| B | J | L | O | P | |
|---|---|---|---|---|---|
| 7 | Competitor | Revenue basis | FY2024A | Q3'25 | YoY |
| 8 | CWAN (reference) | Total revenue | 451.8 | 205.1 | 77.1%1 |
| 9 | SS&C Technologies | Total revenue (one segment) | 5,882.0 | 1,568.0 | 7.0% |
| 10 | BlackRock (Aladdin) | Technology services revenue | 1,603.0 | 515.0 | 27.8%2 |
| 11 | FIS | Capital Market Solutions segment | 2,979.0 | 783.0 | 7.3% |
| 12 | State Street (Alpha) | Front office software and data | 639.0 | 167.0 | 14.4% |
| 13 | SimCorp (Deutsche Börse) | Software Solutions ARR (€M) | 608.0 | 632.0 | 18.0%3 |
- 1Includes Enfusion and Beacon, acquired in April 2025. Core growth slowed from 22% in Q2 to about 17% by Q3 2025.
- 2Includes Preqin. About 12% excluding it, per BlackRock's Q3 2025 call.
- 3Q3'25 ARR (€M) and ARR growth at constant currency, slightly ahead of Clearwater's 17% organic ARR growth. Software net revenue grew 10%.
Permira and Warburg Pincus agreed on December 20, 2025 to take Clearwater Analytics (NYSE: CWAN) private at $24.55 a share, about $8.4 billion of enterprise value. Clearwater sells investment accounting, reporting and, since buying Enfusion in 2025, front-office software to insurers, asset managers and corporate treasuries, on one platform every client shares. The take-private thesis is that this platform leads its market. This page checks the thesis against the rivals’ own filings and earnings calls, as an associate would before the investment committee, with every figure from one Compound run on the public record.
What is a competitive analysis? It compares a company with its rivals on products, pricing, revenue, growth, margins and strategy. Industry analysis, or industry research, adds the structure and economics of the market around them. In a buyout, the two become the IC memo’s industry section and set the peer group for comps. Customer surveys and focus groups are market research, a separate job. How big the market is lives on market sizing.
How to do a competitive analysis on a deal, in the order the work is done: map the rivals from the filings, read their earnings calls, test the moat, read the bidder list, then keep the map current.
A competitive landscape built from 10-K filings
Clearwater’s own 10-K names its competitors. Compound read every version of that list. The IPO prospectus and the 2024 10-K name the same eight: SS&C, BlackRock’s Aladdin, FIS, State Street’s Alpha, SimCorp, BNY’s Eagle, Northern Trust and SAP. The first 10-K after signing names twelve, adding Broadridge, Bloomberg AIM, LayerOne and Coremont, and drops the sentence that no competitor offers a cloud-native platform. The rivals return the favor sparingly: of the four rival 10-Ks Compound read, only SS&C’s names Clearwater, as one of its insurance competitors.
| B | D | J | L | M | R | S | |
|---|---|---|---|---|---|---|---|
| 7 | Competitor | Ownership at signing | Revenue basis | FY2024A | YoY | Margin | Profit measure |
| 8 | CWAN (reference) | Public (NYSE: CWAN); sold to consortium | Total revenue | 451.8 | 22.7% | 32.2% | Adj. EBITDA |
| 9 | SS&C Technologies | Public (Nasdaq: SSNC); CEO owns ~14.0% | Total revenue (one segment)1 | 5,882.0 | 6.9% | 22.8%2 | GAAP operating income |
| 10 | BlackRock (Aladdin) | Public (NYSE: BLK); captive unit | Technology services revenue | 1,603.0 | 7.9% | Not disclosed | |
| 11 | FIS | Public (NYSE: FIS) | Capital Market Solutions segment | 2,979.0 | 7.7% | 51.0%3 | Segment adj. EBITDA |
| 12 | State Street (Alpha) | Public (NYSE: STT) | Front office software and data | 639.0 | 10.2% | Not disclosed | |
| 13 | SimCorp (Deutsche Börse) | Deutsche Börse (acquired 2023, $4.2bn) | Software Solutions ARR (€M)4 | 608.0 | 17.0% | 24.0% | NTM EBITDA margin at 2023 deal |
- 1SS&C reports one segment, so this is all of SS&C, fund administration included. Its 10-K is the only rival filing that names Clearwater.
- 2GAAP operating income, after amortization and stock pay, so not comparable with Clearwater's adjusted EBITDA. On EBITDA before stock pay, SS&C's 2026 Street margin is 40.2%, against 36.0% in Clearwater's plan.
- 3The highest-margin rival line, and its revenue is not tied to client assets, per FIS's Q2 2025 call.
- 4SimCorp's software net revenue grew 10% in Q3 2025. ARR, the like-for-like measure, grew 17% in 2024 and 18% at constant currency in Q3 2025. The margin is the NTM figure at Deutsche Börse's $4.2 billion purchase in 2023, about 6x NTM revenue.
This is the competitive analysis example most templates leave blank, and it carries a judgment in every row. Each large rival sells the overlapping product as one line inside a much bigger company, so the right comparison is the line, and two of them do not disclose its margin. Bloomberg AIM, LayerOne, Coremont, SAP and BNY’s Eagle have no figures in any filing. They stay on the matrix as names. An HHI, the sum of squared market shares an antitrust review uses, needs shares on one basis, and these rivals report on five, so the page gives sizes and growth and leaves concentration out.
The margin column uses four different measures, so it does not rank the rivals. On one measure, EBITDA before stock pay in 2026, Clearwater’s 36.0% is above the vertical software medians in the bankers’ peer set and below SS&C’s 40.2%. FIS’s Capital Market Solutions segment earned 51.0% on segment adjusted EBITDA in 2024, against Clearwater’s 32.2% on adjusted EBITDA.
EBITDA margin before stock pay, 2026E
Clearwater on management's plan, peers on Street consensus
Source: PJT and J.P. Morgan fairness decks (Street consensus, peer groups); DEFM14A pp. 68–69 for Clearwater ($338 million on $940 million). Compound's Comps tab in the valuation workbook.
The table ranks the rivals by size. Who is winning shows in the trend, and the trend is in what they say every quarter.
Competitor analysis from earnings calls
Compound read each rival’s calls for the three quarters Clearwater reported in 2025, and Deutsche Börse’s for SimCorp. Three things came back from every company.
Everyone is moving clients to software as a service. SimCorp’s SaaS revenue grew 22% in Q3 2025 while on-premise revenue fell 1%, and its CFO said a SaaS client “is 2x from a value proposition compared to an on-premise client.” State Street “converted and implemented more clients onto our cloud-based SaaS platform.” FIS said of Capital Markets, “we are taking our SaaS go-to-market strategy and taking share.” The cloud gap Clearwater’s 10-K described in 2024 is closing.
Pricing is rational. FIS reported “1%-2% of net pricing after compression” in Capital Markets and called it “a rational pricing environment.” State Street cited “normal pricing headwinds.” Clearwater’s own Q3 2025 call put its price uplift at “just under 3%,” against “4%-5% contribution in the long run.”
Private credit is everyone’s growth story. SS&C’s private markets grew “over 10%,” BlackRock bought HPS in July 2025, which it said would take its private credit AUM to about $220 billion, and Broadridge reported “strong demand for Sentry, our market-leading private credit solution.” Clearwater’s answer is MLx, which its management describes as “mortgages, private credit, private debt.”
Growth in the overlapping business, Q3 2025
Year over year, excluding acquisitions where the company disclosed it
Source: Clearwater Q3 2025 release and 2024 10-K; rivals' Q3 2025 earnings calls and 10-Qs. Compound's Landscape and Rival calls tabs.
Clearwater still grows faster than the incumbents that report revenue, though its core growth slowed from 22% in Q2 to about 17% by Q3 2025. SimCorp, the closest single-product rival, now grows slightly faster on the like-for-like measure, recurring revenue against recurring revenue, and 27% in North America. Read beside its own calls, Clearwater’s lead is real and getting smaller.
These calls are also the desk version of channel checks: what rivals say about wins, pricing and churn in their own words, cited to the minute. Compound reads those. It does not run expert calls or customer interviews, and commercial diligence still should.
Testing the moat behind the take-private
A moat is a durable advantage that keeps returns above the cost of capital. The take-private’s projections assume one: revenue growing about 17% a year to 2030 on a pro forma basis, and 18% a year from 2028. That holds only if clients stay, pay more and keep choosing Clearwater, so each claim gets tested against the evidence.
| B | C | D | E | F | |
|---|---|---|---|---|---|
| 6 | Moat | Verdict | Score | Trend | Decisive evidence |
| 7 | Single-instance platform | Holds on architecture; 'cloud-native' is no longer unique | 4.0 | Narrowing | Rivals now sell SaaS; none claims one security master |
| 8 | Net revenue retention | Weakening; recovery rests on repricing the acquired base | 2.0 | Weakening | NRR 116% (Q4'24) to 108% (Q3'25)1 |
| 9 | Switching costs | Holds in behavior (98% GRR), not in contract | 4.0 | Holding | GRR 98% vs 30-day cancellation terms2 |
| 10 | Insurer and asset manager base | Holds in US insurance; contested in asset management and abroad | 3.0 | Holding | 31% NA insurer vs 4% AM penetration |
| 11 | Data and AI edge | Unproven; the board treated AI as a risk to value3 | 2.0 | Unproven | Board cited AI in the share-price decline |
| 12 | Average score | 3.0 |
- 1From a standalone peak of 116% to 108% consolidated, back to its 2022-23 range of 103-109%, against a 115% goal. Core NRR was still 114% at Q2 2025. Management cited lower asset growth and asset-based upsell.
- 298% or better in 26 of the last 27 quarters. SS&C reports 97%: the whole industry is sticky.
- 3Compound added this fifth test. The special committee listed AI among the risks to the stand-alone plan (DEFM14A).
The moat test is Porter’s five forces with a citation in every cell: rivalry (SimCorp and Aladdin selling SaaS), new entrants (four rivals the 10-K added after signing), substitutes (clients building in-house, which the 10-K lists as a risk), buyer power (contracts that can generally be cancelled on 30 days’ notice) and the price uplift clients accept.
Retention is the weak test
−8 pts from peak
Stickiness holds, by behavior
98% GRR
The insurer base is the moat
31% vs 4%
The scorecard averages 3.0 of 5: a durable franchise, and a contested one. Those scores are Compound’s view. The bidder list shows what every other buyer of the asset concluded.
The bidder list as a map of the industry
Most readers go through a merger proxy’s background section for process: who called whom, when the price moved. It is also the one document where every serious buyer of the asset shows its hand. Compound logged every party in Clearwater’s.
Who looked at Clearwater in 2025, and who bid
Parties as the DEFM14A letters them. The proxy withholds their names.
Source: Clearwater DEFM14A, Background of the Merger. Compound's Bidders tab.
Outside the consortium, 52 parties were contacted, 12 signed NDAs, and one bid: Sponsor Party A, at $20.00 to $22.00, its midpoint 14.5% below the signed price. Sponsor Party C would provide financing only up to $24.00. Not one of the six strategic parties the proxy describes bid. Their stated reasons were the company’s size and competing priorities, interest in select assets only, or “strategic and commercial considerations,” and the go-shop reached 24 strategics for one NDA.
No strategic would pay for the platform
0 of 6
The former owners set the price
$24.55
The price beat the precedents
8.9x revenue
No industry report records who put money and time behind a view of the industry. The background section does. Read against the landscape, it says the market for Clearwater was sponsor-led, and the natural exit buyer is another sponsor or a public offering.
Competitor tracking and the landscape page
A landscape built once is stale by the next earnings season. Compound follows each rival’s calls, 10-Qs, 8-Ks and news with a note of what you care about, and keeps each rival’s view in a company table the next task reads back. A corporate competitive intelligence team runs the same competitor monitoring with a stack of tools. Here one prompt sets it up.
The same run put the industry view on one page for the IC deck: the competitor table, the moat scorecard and what would change the thesis.
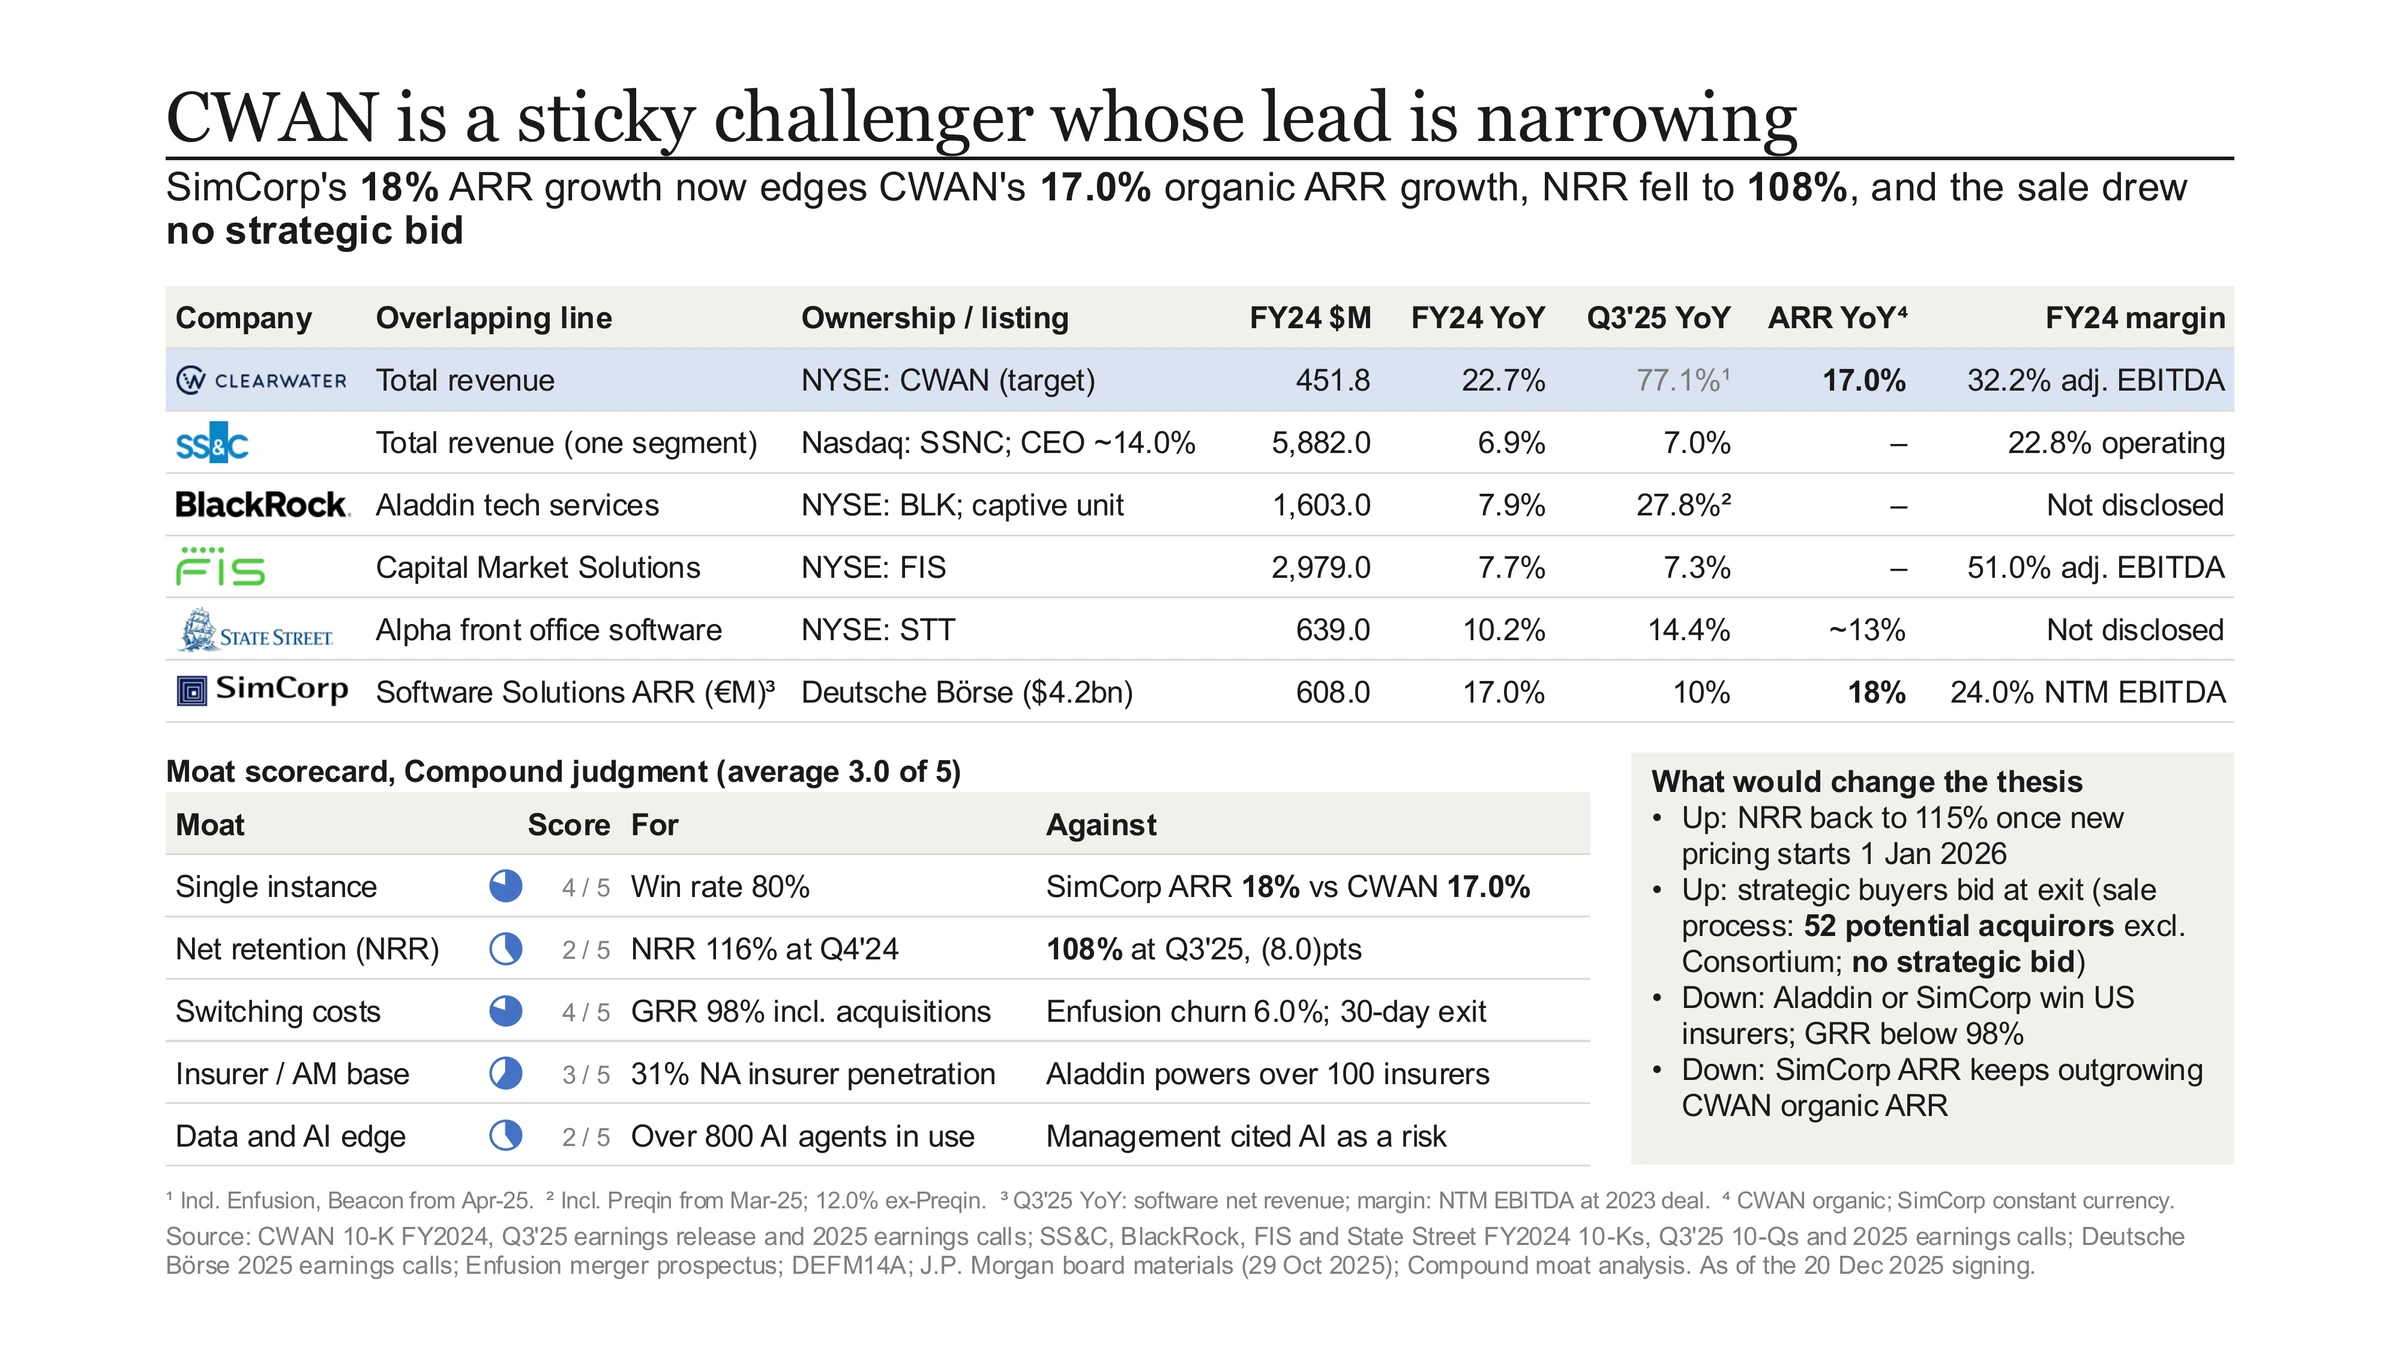
The landscape also sets the peer group for valuation: SS&C is the size comparable, and SimCorp and Enfusion are the deal precedents.
What the competitive analysis changes in the deal
Clearwater is the challenger that grows faster than the incumbents reporting revenue, in a market where every large rival sells the same product as one line of a bigger company. It is not the most profitable: SS&C earns a higher margin before stock pay, and FIS’s capital markets segment keeps about half its revenue as EBITDA. Its stickiness is real and shared by the whole industry. Its lead is narrowing: SimCorp now grows slightly faster, Aladdin serves over 100 insurers, and net revenue retention fell eight points from its peak, back to its 2022-23 range. The earnings call analysis traces that retention quarter by quarter, and the DCF shows how much of the price rests on growth lasting. The one thing the industry said with money is that no strategic buyer would pay for the platform, so the exit should be underwritten at a sponsor’s price. The thesis changes if retention climbs back toward 115% as the new pricing reaches clients, or if SimCorp’s recurring revenue keeps outgrowing Clearwater’s.
Competitive analysis workbook (Excel)Compound’s workbook from this run, free and without a form: the Landscape matrix, every rival call quote with speaker and date, the five moat tests with evidence for and against, and the bidder log. Replace the rows with your target’s rivals and keep the structure.Download · Free, no form One-page competitive landscape slide (PowerPoint)Compound’s landscape page for Clearwater: the competitor table, the moat scorecard and what would change the thesis.Download · Free, no formFAQ
Are industry reports from IBISWorld, Gartner, IDC or Forrester still worth buying?
Industry reports give market sizes and forecasts for markets with no public players, in terms an investment committee recognizes. Filings and earnings calls give revenue that ties to audited numbers and what rivals said this quarter. Buy the report when the market is mostly private, and check its numbers against the filings when it is not.
How do you do a competitive analysis on a private target with no filings?
The target’s CIM is the claim, and public rivals’ filings and calls are the evidence. Compound reads the CIM and tests its market and competition sections against those rivals, as on the confidential information memorandum page.
How does desk competitive analysis relate to commercial due diligence?
It is the desk half of commercial due diligence. A commercial diligence provider adds customer interviews, surveys and win-loss calls, which Compound does not run. The desk work tells you which questions those interviews must answer and checks the provider’s numbers against the filings.
Which rivals belong in a competitive landscape?
Start with the 10-K’s own list, then compare it across years: here the list grew from eight to twelve after signing. Use the line each rival reports for the overlapping business, not company revenue, or a diversified rival looks bigger than the fight it is in, and keep rivals with no disclosed figures on the matrix as names.
Can Compound identify the anonymized parties in a merger proxy?
Compound records each party as the proxy names it and labels any match to a known company as an inference. Here the proxy and the banker decks redact every non-consortium bidder’s name, so Strategic Parties A to D stay lettered. Their stated reasons for declining are what the analysis uses.
What are the 5 steps of a competitive analysis?
On a deal, in the order the work is done: map the rivals from their filings, read their earnings calls, test the moat, read the bidder list in the merger proxy, then keep the map current. Each step on this page starts from one Compound prompt, and every figure is cited to a filing or call.
What is the difference between market research and industry research?
Industry research covers the structure and economics of the market a company competes in, and competitive analysis compares the company with its rivals inside it. Market research asks customers directly, through surveys and focus groups, which is a separate job. In a buyout, the industry work becomes the IC memo’s industry section and sets the peer group for comps.