| B | C | D | E | |
|---|---|---|---|---|
| 25 | Check group | Checks | Tie | Do not tie |
| 26 | Subtotals foot | 13 | 13 | 0 |
| 27 | Balance sheet balances | 1 | 1 | 0 |
| 28 | Cash and cross-statement ties | 5 | 5 | 0 |
| 29 | Mapping completeness | 4 | 4 | 0 |
| 30 | Each year vs next year's comparatives | 3 | 3 | 0 |
| 31 | Audited FS vs FS Excel and signed copies | 2 | 2 | 0 |
| 32 | Total | 28 | 281 | 0 |
- 1Every check ties: the statements foot, cross-tie, map completely and match the next year's comparatives, so nothing was restated
You are the credit analyst on a new name, or the associate on the deal team. The data room for Ironvale Digital Infrastructure, a US data center operator, holds three audited financial statements as PDFs: FY23 (document 2.01), FY24 (2.02) and FY25 (2.03). Beside them sit management’s consolidated statements in Excel (2.04) and scanned signed copies of each audit (2.10 to 2.12).
Before anyone builds a model, writes a credit memo or retests the seller’s quality of earnings, someone has to spread those statements: every line into Excel, as reported, and proven right. This page takes that one step at a time, each step run in Compound. The answer at the end: all 28 tie-out checks pass, nothing was restated, and the four open points are presentation and scope, none of which moves a figure.
Financial spreading is copying a company’s income statement, balance sheet and cash flow statement into a standard template, so that years and companies can be compared and modeled. Lenders spread every borrower’s statements before underwriting and again at each covenant test. Buyers spread the target’s statements before the diligence starts.
A PDF to Excel converter and a spread are different deliverables. A converter copies the tables it can see and leaves you to check them. A spread puts every line into a standard chart of accounts, cites every figure to its page, and carries checks that prove the subtotals foot, the balance sheet balances and each year agrees with the next year’s comparatives. A converter cannot tell you whether a copied number is right. The checks can.
Ironvale Digital Infrastructure and Project Voltaic are fictional: the company and its data room are the open data room of PE Bench, published under CC-BY-4.0. Everything Compound produced on this page is real: the workbook and slide come from one Compound run on that room, quoted unedited apart from excerpts.
How to spread financial statements from PDF into Excel
The first step copies each statement into Excel exactly as printed, one row per line, with every figure cited to its PDF page.
| B | C | D | E | F | |
|---|---|---|---|---|---|
| 6 | Line item (as reported) | FY23 | FY24 | FY25 | CoA code |
| 8 | Lease & colocation revenue | 199.4 | 246.9 | 305.0 | 4000 |
| 9 | Metered power reimbursements | 55.8 | 68.7 | 84.2 | 4100 |
| 10 | Interconnection & cross-connects | 9.1 | 11.9 | 14.6 | 4200 |
| 11 | Managed & other services | 3.7 | 4.5 | 8.2 | 4300 |
| 12 | Total revenue | 268.0 | 332.0 | 412.0 | Subtotal |
| 13 | Property operating expenses (incl. power at cost) | (98.7) | (119.5) | (145.2) | 5000 |
| 14 | Property taxes & insurance | (12.8) | (15.9) | (19.6) | 5100 |
| 15 | Ground rent (RNO I) | (0.5) | (0.6) | (0.6) | 5200 |
| 16 | Net operating income (NOI) | 156.0 | 196.0 | 246.61 | Subtotal |
| 17 | General & administrative | (24.1) | (28.4) | (33.8) | 6000 |
| 18 | Non-recurring / transaction costs | (2.9) | (1.6) | (4.8) | 6100 |
| 19 | Other income, net | 4.3 | 8.2 | 11.12 | 7000 |
| 20 | Depreciation & amortization | (88.5) | (104.2) | (126.9) | 8000 |
| 21 | Interest expense, net | (61.2) | (78.9) | (94.3) | 9000 |
| 22 | Net income (loss) | (16.4) | (8.9) | (2.1)3 | Subtotal |
- 1FY25 NOI as printed on 2.03 p.4. Less $33.8M of G&A, it gives $212.8M of EBITDA before other income
- 2Kept as reported. Whether other income belongs in EBITDA is an adjustment for later, not a change to the spread
- 3Entered as printed, not as a formula, so the Checks tab can test that it foots
The balance sheet and cash flow tabs follow the same layout, 61 lines in all. Subtotals are typed in as reported rather than calculated, which is what lets the next step test them. Each line also carries a standard account code, and the CoA Map tab adds the lines up by code, so Ironvale’s “Lease & colocation revenue” sits in the same row as any other company’s rental revenue.
A spread stops at the audited lines. FY25 NOI of $246.6M less $33.8M of G&A is $212.8M of EBITDA before other income. The seller’s adjusted EBITDA and the buyer’s view of it are a separate exercise, set out in the financial due diligence example.
Takeaway: the spread is the audited statements line for line, every figure cited, and the next question is whether those figures are right.
Tie-out checks: does the spread prove itself?
The second step recomputes every subtotal and every link between the statements, and sets the reported figure beside the recomputed one.
| B | E | H | K | L | |
|---|---|---|---|---|---|
| 6 | Check | Reported FY25 | Recomputed or 2nd source FY25 | Diff FY25 | Status |
| 8 | Total revenue | 412.0 | 412.0 | - | Ties |
| 9 | Net operating income (NOI) | 246.6 | 246.6 | - | Ties |
| 10 | Net income (loss) | (2.1) | (2.1) | - | Ties |
| 13 | Total assets | 2,200.6 | 2,200.6 | - | Ties |
| 23 | Total assets = total liabilities and members' equity | 2,200.6 | 2,200.6 | - | Ties |
| 26 | Cash flow closing cash = balance sheet cash | 85.0 | 85.0 | - | Ties |
| 28 | Cash flow net income = income statement net income | (2.1) | (2.1) | - | Ties |
| 29 | IS D&A = CF depreciation + leasing cost amortization | (126.9) | (126.9) | - | Ties |
| 30 | Members' equity roll-forward (prior equity + net income + distributions) | 485.7 | 485.71 | - | Ties |
- 1FY24 equity of 667.0, less the $2.1M net loss and $179.2M of FY25 distributions
The 28 checks fall into six groups: 13 subtotals that foot, the balance sheet balancing, five cash and cross-statement ties, four checks that the mapped lines rebuild every total, three against the next year’s statements and two against the FS Excel and the signed copies. Closing cash on the cash flow statement agrees to balance sheet cash in all three years, and FY24 and FY25 opening cash agree to the prior year. Each status cell reads “Ties” only when every difference rounds to zero at one decimal, so a broken link shows up the moment a figure changes.
Takeaway: all 28 checks tie, so the spread is internally consistent. A spread can be consistent and still out of date, so did any year get restated?
Restatement check: each year against the next year’s comparatives
The third step sets each year’s audited figures against the comparatives printed in the following year’s statements, and against management’s Excel.
| B | D | F | G | J | M | |
|---|---|---|---|---|---|---|
| 6 | Line item | FY24 audited | FY24 comparative in FY25 FS | Diff | FY25 per FS Excel | Diff FY25 |
| 12 | Total revenue | 332.0 | 332.0 | - | 412.0 | - |
| 16 | Net operating income (NOI) | 196.0 | 196.0 | - | 246.6 | - |
| 22 | Net income (loss) | (8.9) | (8.9) | - | (2.1) | - |
| 36 | Total assets | 1,902.3 | 1,902.3 | - | 2,200.6 | - |
| 37 | Accounts payable and accrued liabilities (incl. construction) | 74.0 | 74.0 | - | 96.31 | - |
| 46 | Members' equity | 667.0 | 667.0 | - | 485.7 | - |
| 72 | Cash at end of period | 70.0 | 70.0 | - | 85.0 | - |
- 1The FS Excel drops '(incl. construction)' from this label. The amounts agree in all three years
The FY25 statements repeat all 61 FY24 lines unchanged, and the FY25 audit report says the comparatives are consistent with the FY24 audited statements. FY23 needs another route, because the FY24 statements show one year only. Compound tied it to the FY23 column of Schedule I in the FY25 statements, ten lines, and to the $695.3M of opening equity in the FY25 equity statement. Management’s Excel agrees with the audited PDFs on every figure, and the scanned signed copies carry the same numbers.
Takeaway: nothing was restated and management’s Excel matches, but the audited PDF stays the source. What is left open?
What did not tie, and what the room cannot test
The last step lists every point the checks left open, and none of them moves a figure.
FS Excel drops part of the AP label
Presentation
FY23 construction draws left blank
Presentation
FY23 opening balances have no FY22 support
Not testable
The signed FY25 audit report is shorter
Wording
The untestable openings are the one item worth a request. If the FY23 opening figures matter to your analysis, ask for the FY22 audited balance sheet, or take the FY23 statements as the start of the record. Compound put the spread, the checks and the four open points on one slide.
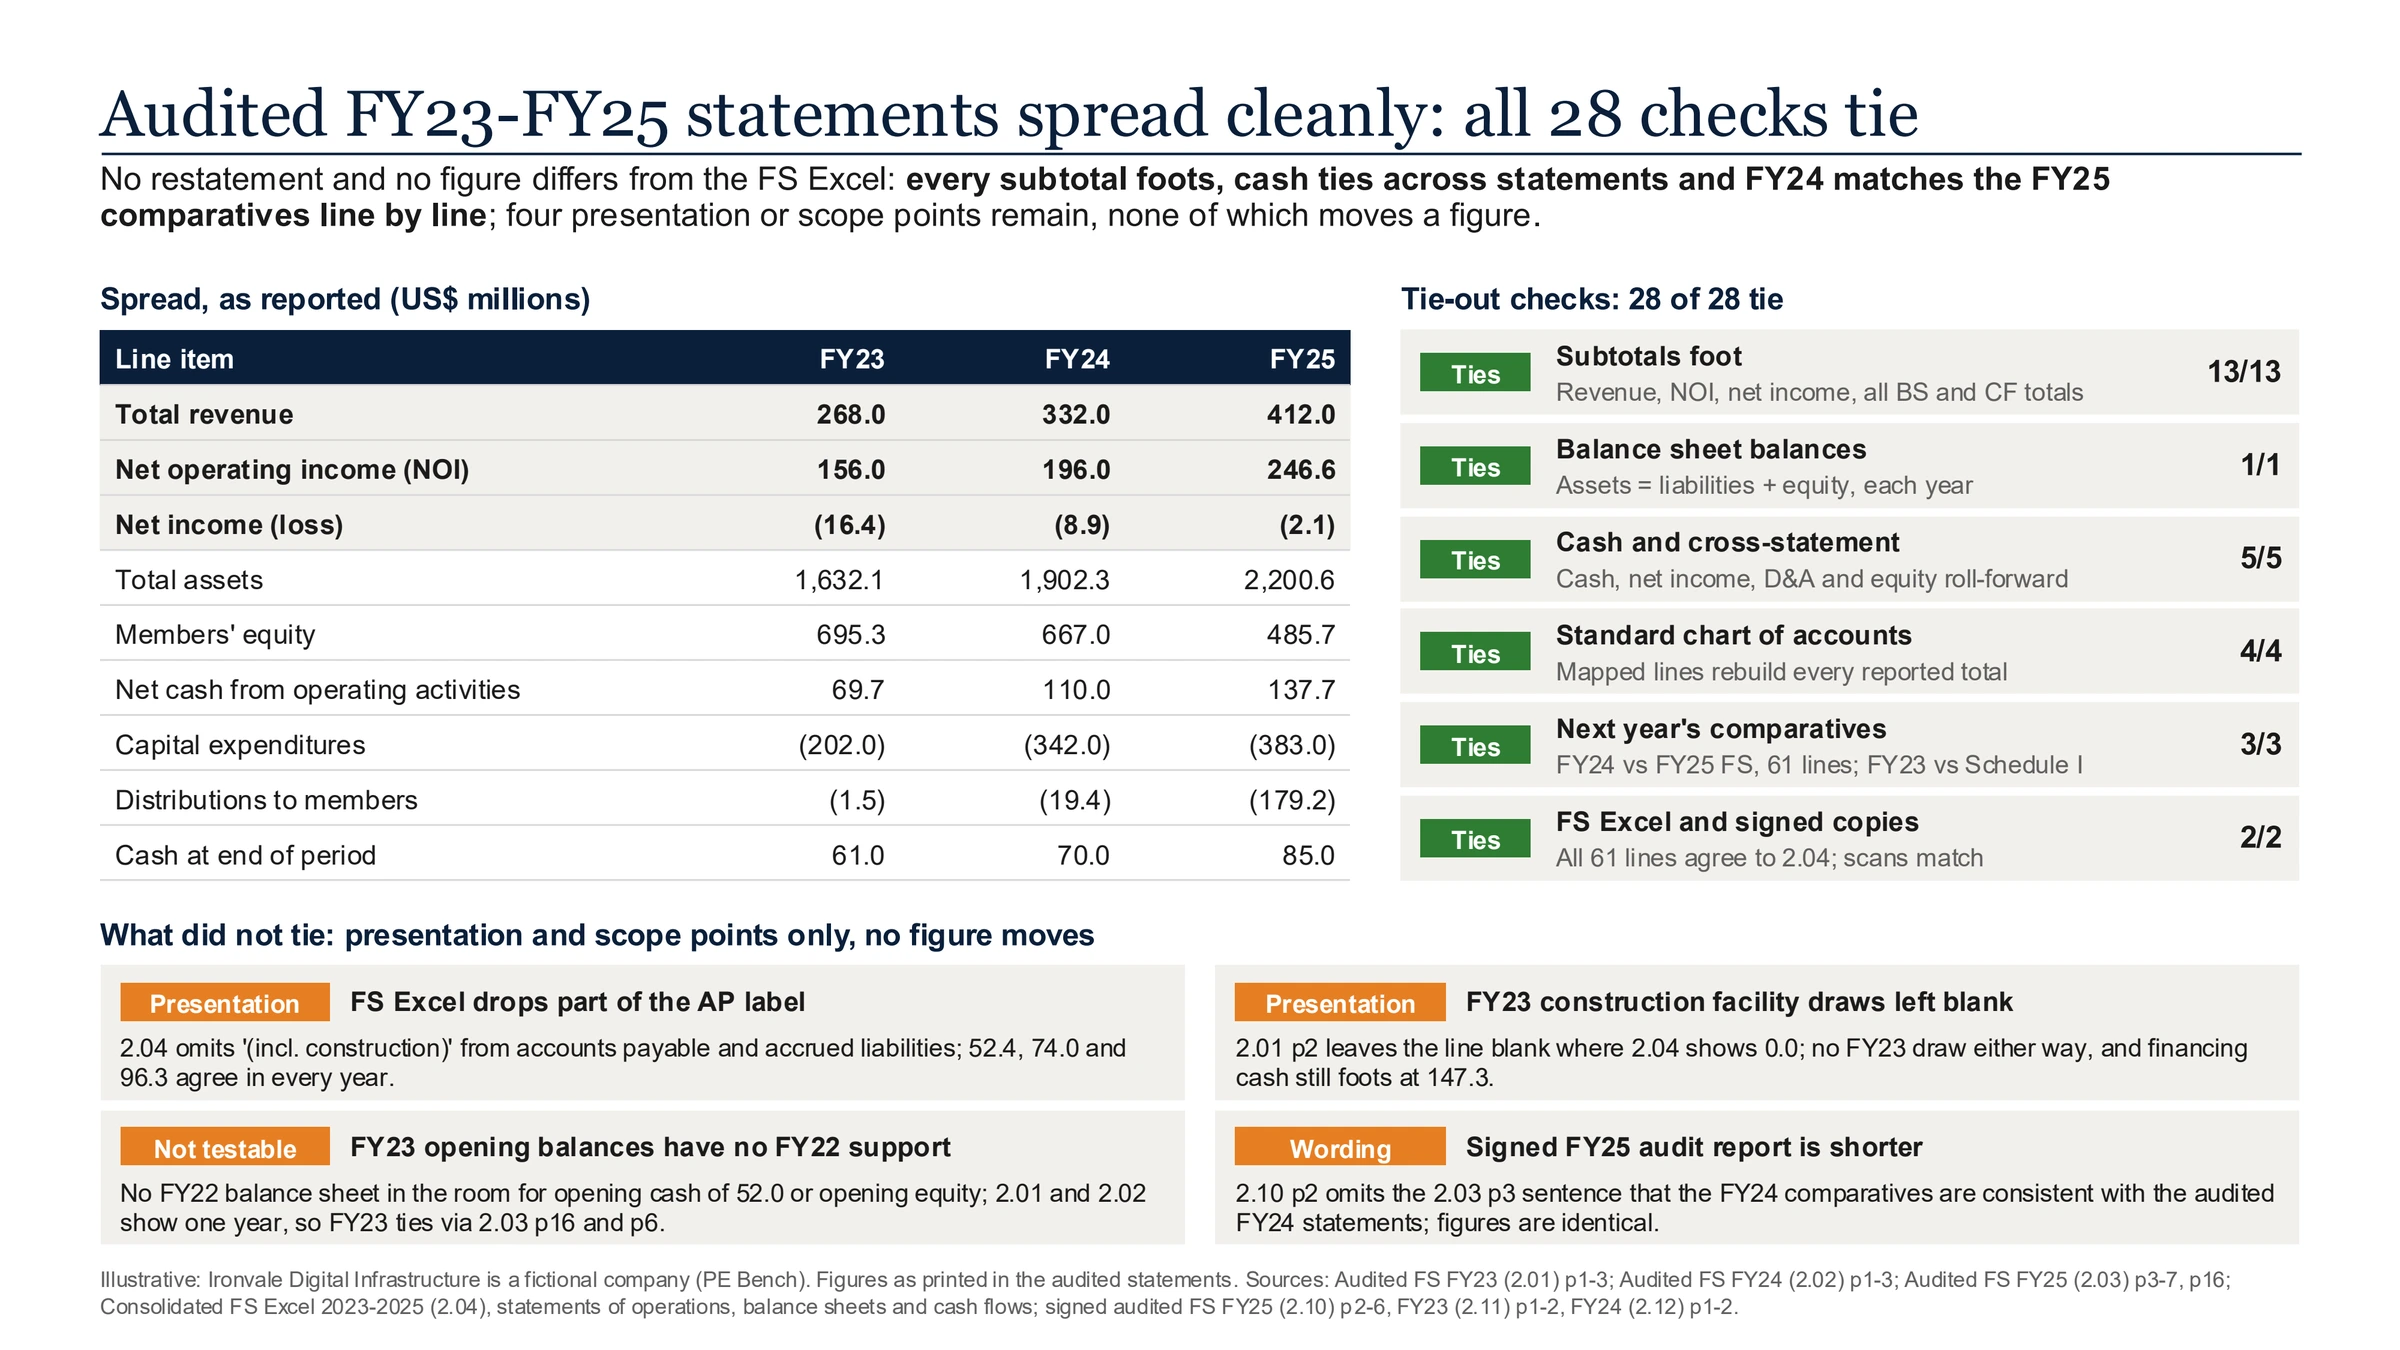
From here the spread is the base for the work that does change numbers: the add-backs on the adjusted EBITDA example and a forecast in a three-statement model. Because the as-reported spread is kept separate, every adjustment made later can be traced back to an audited line.
Takeaway: the spread ties, nothing was restated, and the only gap is FY23’s opening balances, which no document in the room can support.
Financial spreading workbook (Excel)Compound’s workbook from this run, free and without a form: Summary, the income statement, balance sheet and cash flow as reported with every figure cited to its page, the CoA Map, the 28 checks and the line-by-line Recon. Use it as a spreading template: replace the reported figures with your company’s and the checks carry through.Download · Free, no form One-page spread slide (PowerPoint)Compound’s slide for Ironvale: the spread as reported, the six check groups and the four open points.Download · Free, no form