| B | C | D | E | F | G | |
|---|---|---|---|---|---|---|
| 5 | Fiscal year | 2021 | 2022 | 2023 | 2024 | 2025 |
| 7 | Starting ARR (prior year-end, disclosed) | 219.9 | 277.8 | 323.5 | 379.1 | 474.9 |
| 10 | (-) Churn, est. from GRR | (4.4) | (5.6) | (6.5) | (7.6) | (9.5) |
| 11 | (+) Expansion, est. from NRR less GRR | 28.6 | 22.2 | 29.1 | 68.2 | 71.2 |
| 13 | (+) New logos, est. (remainder) | 33.7 | 29.0 | 33.0 | 35.2 | 22.3 |
| 17 | Acquired ARR, total (disclosed) | – | – | – | – | 282.0 |
| 18 | Ending ARR (disclosed) | 277.8 | 323.5 | 379.1 | 474.9 | 841.0 |
You are the associate on a private equity team that underwrites recurring-revenue software. In December 2025 Permira and Warburg Pincus agreed to take Clearwater Analytics (NYSE: CWAN) private at $24.55 a share, about $8.4B of transaction value. Clearwater sells investment accounting software on recurring contracts, and it reports ARR and retention every quarter. The deal closed in June 2026, and your partner wants to know what the retention record behind it really supports.
Your job is to answer one question: does Clearwater’s customer retention carry the growth that the price assumes? This page takes the analysis one step at a time, each step run in Compound on the 10-Ks, the latest 10-Q, the earnings calls and the merger proxy. The answer at the end: retention protects the base, but it does not yet carry the plan. Figures in the text are rounded, in $M. The tables show Compound’s exact figures.
A few terms first. Annual recurring revenue (ARR) is the recurring revenue a company would bill over a year at its current run rate. Gross revenue retention (GRR) is the share of last year’s revenue that customers kept, counting only losses. Net revenue retention (NRR) adds what the same customers bought on top, so it can exceed 100%. A cohort analysis follows one group of customers, usually by the year they signed, through those rates over time. An ARR bridge walks starting ARR to ending ARR through churn, expansion, new customers and acquisitions.
Clearwater does not publish cohort tables. It discloses ARR, GRR and NRR each quarter, plus rounded client counts. So the bridge and the cohort view on this page are derived by Compound from those disclosed rates, and each table marks which figures are disclosed and which are derived.
Gross and net revenue retention: read the company’s definitions first
The first step pins down what Clearwater’s own retention metrics count, before any of them is used.
“From [company]'s 10-Ks and 10-Qs for the last five years, extract the definitions of ARR, gross revenue retention and net revenue retention, quote them with their printed page, and flag every change in wording, basis or scope, including when acquired businesses entered the metrics.”
Retention metrics are not standard. One company’s GRR counts downsell and another’s does not, and an acquisition can change what NRR measures in the middle of a year. Compound quoted Clearwater’s definitions from the filings and wrote down what each means for the analysis.
| B | C | F | |
|---|---|---|---|
| 6 | Metric | Company definition | What it means for this analysis |
| 7 | ARR | Annualized recurring revenue is calculated at the end of a period by dividing the recurring revenue in the last month of such period by the number of days in the month and multiplying by 365. | Run-rate of the last month's recurring revenue; asset-based fees move it with clients' AUM. |
| 8 | Gross revenue retention (GRR) | Gross revenue retention rate represents annual contract value (“ACV”) at the beginning of the 12-month period ended on the reporting date less client attrition over the prior 12-month period, divided by ACV at the beginning of the 12-month period, expressed as a percentage. | Measured on ACV, not ARR: the base includes contracted-not-billed revenue. |
| 9 | ACV | ACV is comprised of annualized recurring revenue plus contracted-not-billed revenue (contracted revenue not yet recognized). | Signed-not-live revenue sits in the GRR base but not in the NRR base. |
| 10 | Client attrition | Client attrition occurs when a client provides a contract termination notice; it is recorded in the month the final billing occurs. | GRR counts terminations only. Partial downsell is not attrition, so it sits inside NRR.1 |
| 11 | Net revenue retention (NRR) | Net revenue retention rate is the percentage of recurring revenue retained from clients on the platform for 12 months and includes changes from the addition, removal or value of assets on our platform, contractual changes that have an impact to annualized recurring revenues and lost revenue from client attrition. It compares current ARR of clients on the platform 12 months earlier with their ARR 12 months earlier. | ARR basis; includes AUM moves, price, upsell, cross-sell, downsell and churn. From Q2 2025 it includes acquired entities.2 |
- 1Partial downsell is not attrition, so Clearwater's GRR shows only full terminations
- 2From Q2 2025 NRR includes Enfusion and Beacon. The 10-K gives NRR without them only for Q2 to Q4 2025
Two points matter for everything that follows. Clearwater’s GRR counts only clients who give notice, so a client who cuts its spend shows up in NRR, not GRR. And from the second quarter of 2025 both rates include the businesses Clearwater bought, so the 2025 figures are not comparable with earlier years unless you take them out.
Takeaway: GRR here is a floor on terminations, and NRR carries everything else. The next question is what the two rates have done over five years.
Net revenue retention by year: the disclosed record
The second step lays out five years of ARR, clients and retention exactly as the filings report them.
| B | D | E | F | G | H | |
|---|---|---|---|---|---|---|
| 5 | Fiscal year | 2021 | 2022 | 2023 | 2024 | 2025 |
| 7 | ARR at year-end ($m) | 277.8 | 323.5 | 379.1 | 474.9 | 841.0 |
| 8 | of which acquired entities: Enfusion, Beacon, Bistro ($m) | n.d. | n.d. | n.d. | n.d. | 282.0 |
| 9 | Clients at year-end (over) | 1,100 | 1,200 | 1,300 | 1,400 | 2,5001 |
| 10 | Clients with ARR of at least $1m | 59 | 67 | 86 | 100 | 152 |
| 11 | Clients added in year (over; 'new' FY21-22, 'net new' FY23+) | 100 | 130 | 80 | 100 | 1,000 |
| 12 | of which added through Enfusion and Beacon (over) | n.a. | n.a. | n.a. | n.a. | 900 |
| 13 | Gross revenue retention, Q4 | 98% | 98% | 98% | 98% | 98%2 |
| 14 | Net revenue retention, Q4 | 111% | 106% | 107% | 116% | 109% |
| 15 | Net revenue retention excl. acquired entities, Q4 | n.a. | n.a. | n.a. | n.a. | 113%3 |
- 1Over 900 of the over 1,000 clients added in 2025 came with Enfusion and Beacon
- 2GRR was 98% or better in 27 of the 28 quarters from 2019 to 2025. Only Q1 2023 printed 97%
- 3Without the acquired businesses, Q4 2025 NRR was 113%
Clearwater's net retention swings, its gross retention does not
Quarterly revenue retention as disclosed, Q1 2021 to Q4 2025
Source: Clearwater 10-Ks FY2021 to FY2025 and 10-Q Q3 2025, retention tables. The plan line is derived by Compound, Price Read-across tab, C21.
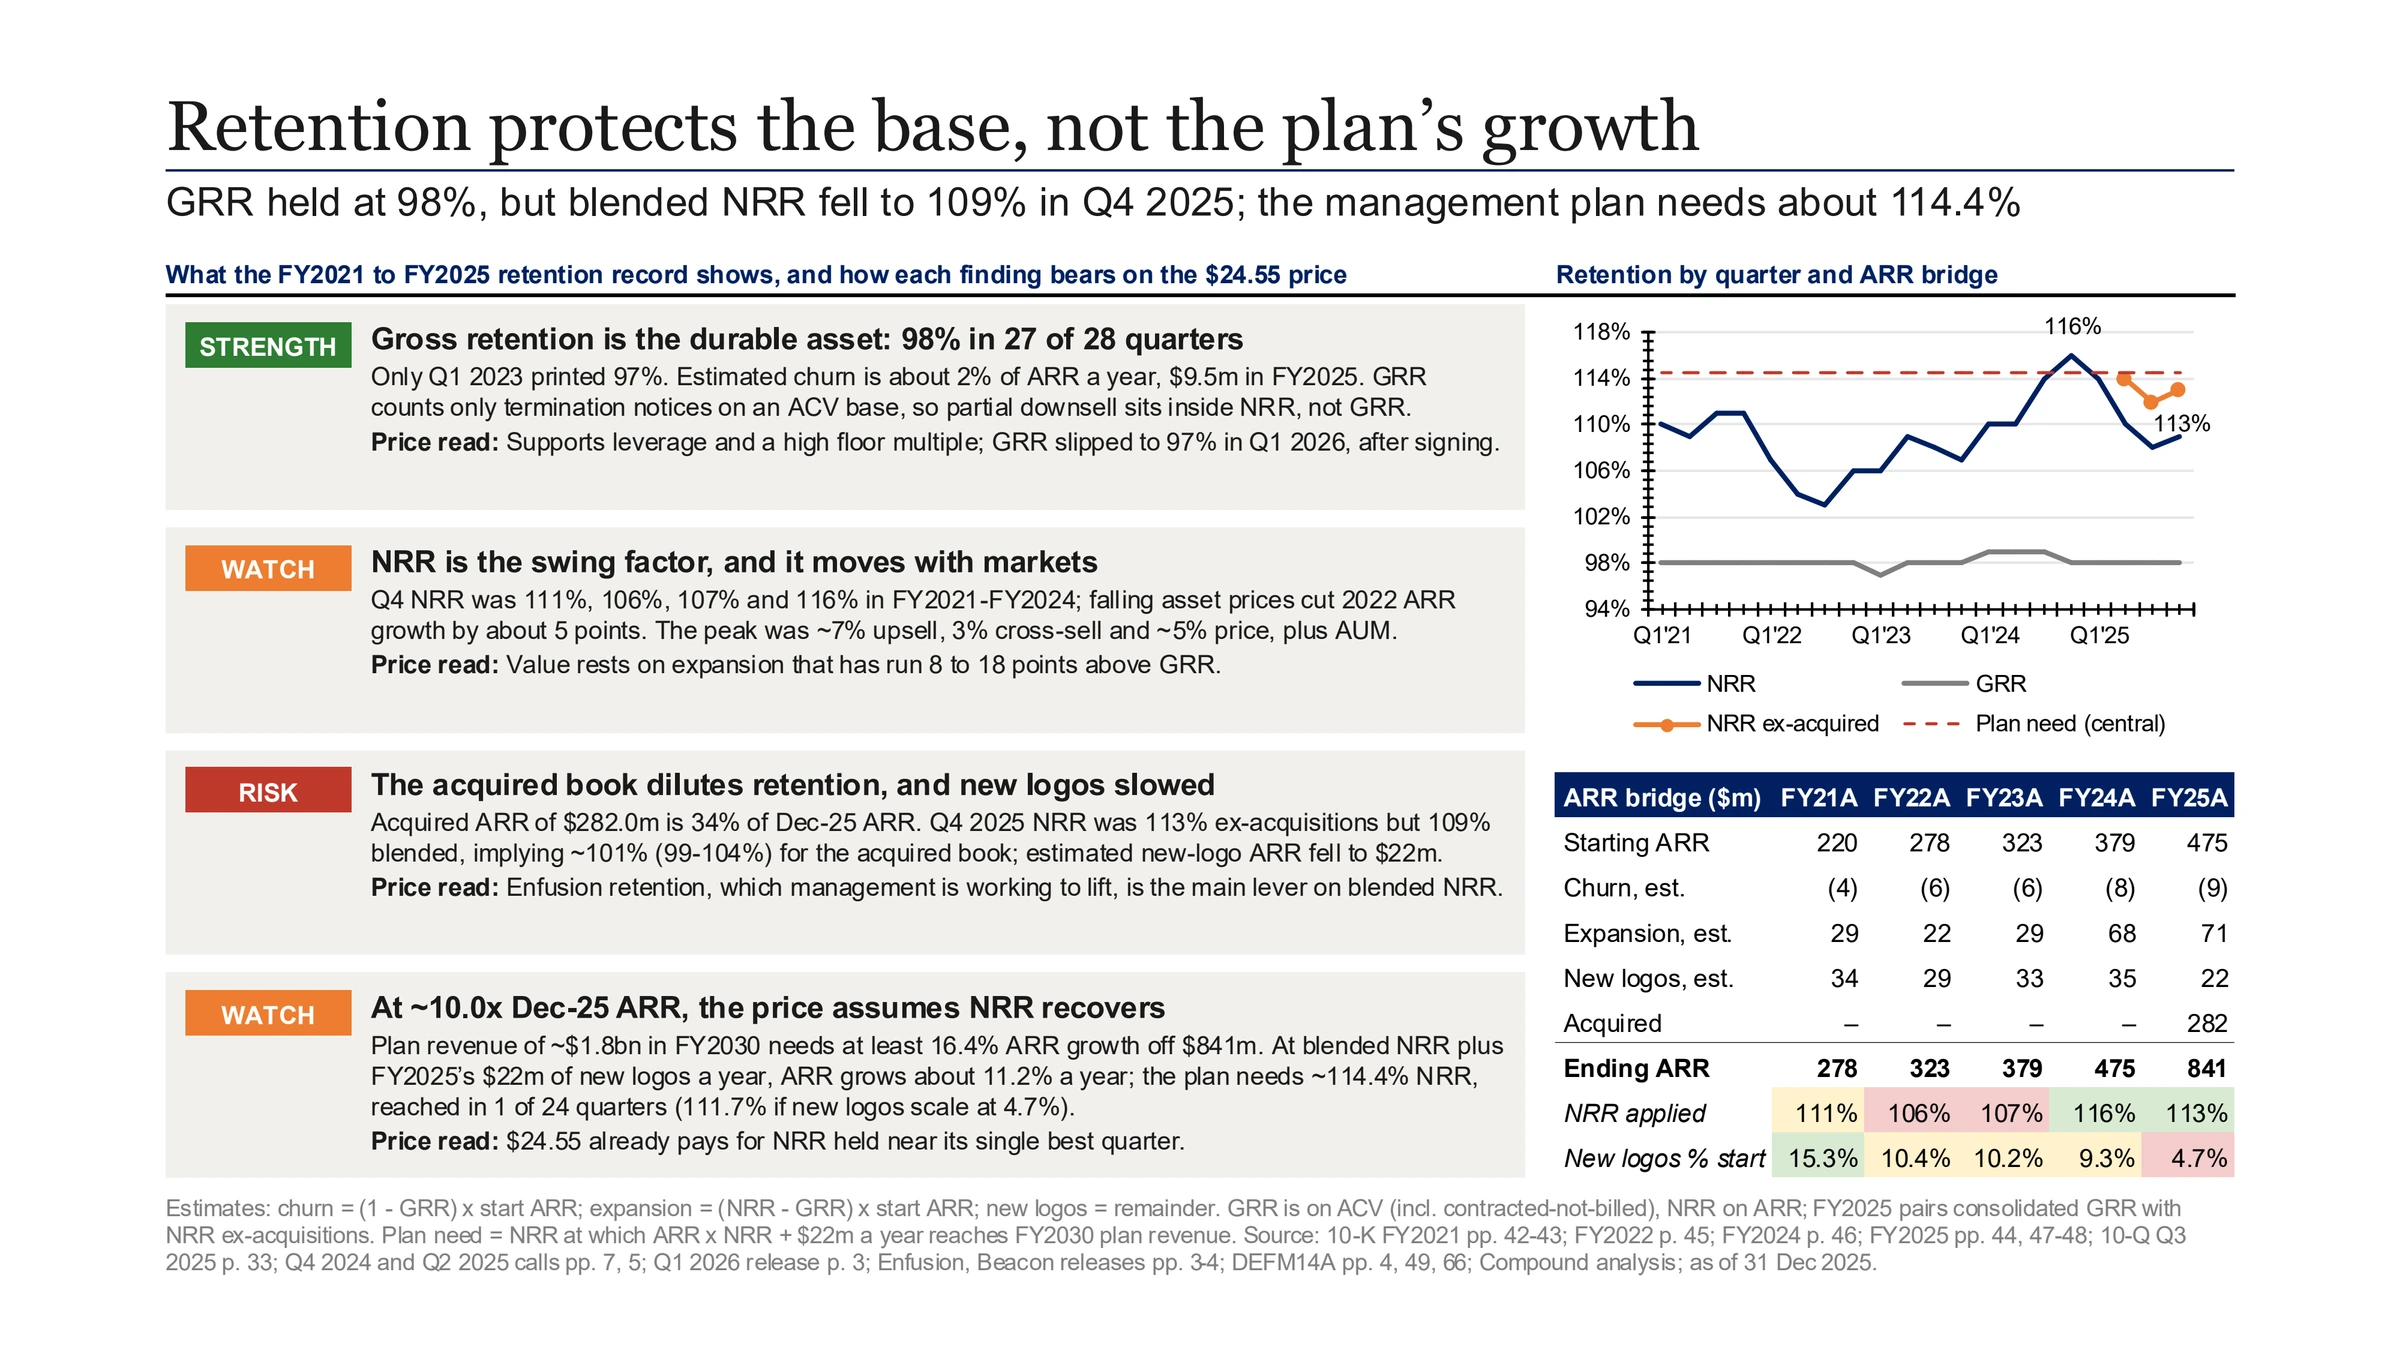
GRR is the steadiest number in the filings: 98% in every fourth quarter, and 98% or better in all but one quarter since 2019. NRR is the number that moves. It ran between 103% and 116% over the five years, falling in 2022 and peaking at 116% at the end of 2024. Clearwater’s fees are partly based on its clients’ assets, so NRR rises and falls with markets as well as with selling. At the end of 2025 it was 109%, but 113% without Enfusion, Beacon and Bistro, so most of the drop from 116% is the mix of the acquired businesses.
Takeaway: churn is low and stable, and expansion drives the growth. The next question is how much of each year’s ARR came from expansion and how much from new clients.
ARR bridge: churn, expansion, new logos and acquired ARR
The third step walks each year’s starting ARR to its ending ARR, using the disclosed rates to estimate how the change splits.
Clearwater does not disclose churned ARR, expansion or new-client ARR in dollars, so Compound estimated them. Churn is starting ARR times one minus GRR. Expansion is starting ARR times NRR less GRR. Acquired ARR is the disclosed $282.0M, and new-logo ARR is whatever is left to reach the disclosed ending ARR.
These three lines are estimates, not reported ARR movements, for two reasons. Clearwater measures GRR on annual contract value, which includes signed revenue not yet billed, while NRR and ARR are measured on ARR, so the bridge applies two different bases to the same starting ARR. And for 2025 it pairs consolidated GRR, which includes the acquired businesses, with NRR that excludes them. Only starting, acquired and ending ARR are disclosed.
| B | C | D | E | F | G | |
|---|---|---|---|---|---|---|
| 5 | Fiscal year | 2021 | 2022 | 2023 | 2024 | 2025 |
| 7 | Starting ARR (prior year-end, disclosed) | 219.9 | 277.8 | 323.5 | 379.1 | 474.9 |
| 8 | GRR applied (Q4, disclosed; ACV basis) | 98% | 98% | 98% | 98% | 98% |
| 9 | NRR applied (Q4, disclosed; ARR basis; FY2025 excl. acquired entities) | 111% | 106% | 107% | 116% | 113%1 |
| 10 | (-) Churn, est. from GRR | (4.4) | (5.6) | (6.5) | (7.6) | (9.5) |
| 11 | (+) Expansion, est. from NRR less GRR | 28.6 | 22.2 | 29.1 | 68.2 | 71.2 |
| 12 | Retained ARR from starting base, est. | 244.1 | 294.4 | 346.1 | 439.8 | 536.7 |
| 13 | (+) New logos, est. (remainder) | 33.7 | 29.02 | 33.0 | 35.2 | 22.33 |
| 17 | Acquired ARR, total (disclosed) | – | – | – | – | 282.0 |
| 18 | Ending ARR (disclosed) | 277.8 | 323.5 | 379.1 | 474.9 | 841.0 |
| 19 | Check: bridge less ending ARR | – | – | – | – | –4 |
| 22 | Churn, est. from GRR | 2.0% | 2.0% | 2.0% | 2.0% | 2.0% |
| 23 | Expansion, est. from NRR less GRR | 13.0% | 8.0% | 9.0% | 18.0% | 15.0% |
| 24 | New-logo ARR, est. | 15.3% | 10.4% | 10.2% | 9.3% | 4.7% |
| 25 | Organic ARR growth | 26.3% | 16.4% | 17.2% | 25.3% | 17.7% |
| 26 | Share of organic ARR added from existing clients, est. | 41.8% | 36.5% | 40.7% | 63.3% | 73.5% |
- 1FY2025 uses NRR excluding the acquired businesses, 113%, against consolidated GRR
- 2FY2022 and FY2024 new logos include the JUMP and Wilshire deals, which Clearwater did not separate
- 3Estimated new-logo ARR fell to $22.3M. NRR is rounded, so this moves by about $2.4M either way
- 4Ties to disclosed ending ARR by construction, since new logos are the remainder
Estimated new-logo ARR has fallen as a share of the base
Estimated new-logo ARR as a percentage of starting ARR, FY2021 to FY2025
Source: Clearwater 10-Ks FY2021 to FY2025. Estimated by Compound as the remainder of the ARR bridge, ARR Bridge tab row 24.
On these estimates, the $474.9M base Clearwater started 2025 with lost about $9.5M to churn and added about $71.2M from expansion. New clients added about $22.3M, and the acquisitions brought in a disclosed $282.0M. Organic ARR grew 17.7%, a disclosed-figure result that the financial statement analysis page also reaches from the 10-K. About 73.5% of that organic growth came from existing clients, against about 40% in 2021 to 2023. The split is an estimate, but the direction is clear: the business grows more and more by selling to the clients it already has.
Takeaway: estimated churn is about 2% of ARR a year, expansion does most of the work, and estimated new-client ARR fell by about a third in 2025. The next question is what the acquired book does to retention.
Blended NRR against NRR excluding acquisitions
The fourth step solves for the retention of the businesses Clearwater bought, which the company does not disclose.
The 10-K gives two rates for the fourth quarter of 2025: 109% for the whole company and 113% without the acquired businesses. Weighting each by its starting ARR, Compound solved for the third rate, the acquired book’s own, from the pre-deal ARR in the Enfusion and Beacon releases.
| B | G | |
|---|---|---|
| 14 | (+) Acquired: Enfusion, est. (ARR at Dec-24, pre-close) | 210.5 |
| 15 | (+) Acquired: Beacon, est. (ARR at end-2024, pre-close) | 44.0 |
| 16 | (+) Acquired: post-close growth and other, incl. Bistro, est. | 27.5 |
| 17 | Acquired ARR, total (disclosed) | 282.0 |
| 34 | NRR consolidated incl. acquired entities, Q4 (disclosed) | 109% |
| 35 | Implied NRR of acquired book, Q4 (derived) | 101.5%1 |
| 39 | Implied NRR of acquired book: low (blended -0.5pp, core +0.5pp) | 99.2% |
| 40 | Implied NRR of acquired book: high (blended +0.5pp, core -0.5pp) | 103.9% |
- 1The acquired book barely grows: about 101.5%, against 113% for the core business
The acquired businesses are a third of Clearwater’s ARR, $282.0M of $841.0M. Their implied NRR is about 101.5%, and between 99.2% and 103.9% once the rounding of the disclosed rates is allowed for. So for as long as the acquired book is this large, blended NRR sits about four points below the core business. This is the same 109% that the regulatory filing review page traces to the change in what the KPI includes.
Takeaway: the core still retains at 113%, the acquired book at about 101%, and the blend is what the buyers own. The next question is what the record looks like viewed as cohorts.
Cohort analysis from disclosed NRR: what each year’s base became
The fifth step tracks each year’s starting ARR and each year’s new clients forward, to see how much of today’s ARR comes from older clients.
This is not a true cohort table. A true one needs revenue by customer and by signing year, and Clearwater publishes neither. Compound applied the company-wide NRR to every vintage, so every cohort retains at the same rate by construction, and each vintage after 2020 starts from the bridge’s estimated new-logo ARR. What the view can show is how fast the base compounds and how much of today’s ARR rests on older clients. It cannot show whether newer clients retain better or worse than older ones.
| B | C | D | E | F | G | H | |
|---|---|---|---|---|---|---|---|
| 32 | Vintage | 2020 | 2021 | 2022 | 2023 | 2024 | 2025 |
| 33 | Clients on platform at Dec-20 (FY2020 year-end ARR) | 219.9 | 244.1 | 258.7 | 276.8 | 321.1 | 362.91 |
| 34 | FY2021 new logos, est. | 33.7 | 35.7 | 38.2 | 44.3 | 50.1 | |
| 35 | FY2022 new logos, est. (incl. JUMP) | 29.0 | 31.0 | 36.0 | 40.7 | ||
| 36 | FY2023 new logos, est. | 33.0 | 38.3 | 43.2 | |||
| 37 | FY2024 new logos, est. (incl. Wilshire) | 35.2 | 39.7 | ||||
| 38 | FY2025 new logos, est. | 22.3 | |||||
| 39 | Acquired book: Enfusion, Beacon, other | 282.0 | |||||
| 40 | Total ARR, derived | 219.9 | 277.8 | 323.5 | 379.1 | 474.9 | 841.0 |
| 41 | ARR as disclosed | 219.9 | 277.8 | 323.5 | 379.1 | 474.9 | 841.0 |
| 42 | Check: derived less disclosed | – | – | – | – | – | –2 |
| 43 | Dec-20 clients, % of organic ARR | 100% | 88% | 80% | 73% | 68% | 65%3 |
| 44 | FY2021-FY2025 new-logo vintages, % of organic ARR | 0% | 12% | 20% | 27% | 32% | 35% |
- 1Derived: Dec-2020 ARR compounded at each year's disclosed NRR, 165% of its starting value after five years
- 2Ties to disclosed ARR by construction, since new logos are the bridge's remainder
- 3Clients on the platform at the end of 2020 still provide 65% of organic ARR
The clients Clearwater had at the end of 2020 brought $219.9M of ARR. Five years later, on the disclosed rates, they would bring about $362.9M, an estimated 65% of organic ARR. The workbook’s gross retention floor shows the other side: before any expansion, 98% a year leaves 90.4% of a base after five years. Both views rest on rates that apply to the whole company, so they describe the base, not the difference between vintages.
To test vintages, you need customer-level billing data. In a data room you would build true cohorts by the year each customer first signed, as the financial due diligence page does inside a full quality of earnings review.
Takeaway: on these estimates the older base still provides about two thirds of organic ARR and keeps growing, which is the strength of the business. The last question is whether that retention reaches the growth the price assumes.
Retention against the $24.55 price: the NRR the plan needs
The last step turns management’s revenue plan into the NRR it requires, and compares that with the record.
Management’s plan in the merger proxy takes revenue from about $730M in 2025 to about $1.8B in 2030, 20% a year (DEFM14A p. 66). Starting from $841.0M of ARR at the end of 2025, that needs at least 16.4% a year of ARR growth. It is a lower bound, since year-end ARR runs ahead of full-year revenue in a growing business. ARR growth is roughly NRR less 100% plus new-logo ARR as a share of the base, so the NRR the plan needs depends on what you assume for new clients. Compound’s central case holds 2025’s estimated $22.3M of new-logo ARR flat in dollars. That is 2.7% of the $841.0M base in the first year, and a smaller share each year after, so the central NRR is the rate that, with $22.3M of new logos a year, reaches the plan’s 2030 ARR in five annual steps.
| B | C | |
|---|---|---|
| 9 | Transaction value ($m) | 8,400 |
| 10 | ARR at Dec 31, 2025 ($m) | 841.0 |
| 11 | Transaction value / Dec-25 ARR (x, derived) | 10.0x |
| 12 | Management plan revenue, FY2025 (approx., $m) | 730 |
| 13 | Management plan revenue, FY2030 (approx., $m) | 1,800 |
| 14 | Management plan revenue CAGR, FY2025-FY2030 | 20% |
| 18 | Plan-implied ARR CAGR: Dec-25 ARR to FY2030 plan revenue (derived) | 16.4%1 |
| 19 | New-logo ARR, FY2025, est. ($m) | 22.3 |
| 20 | FY2025 new-logo ARR, % of Dec-25 ARR (first year only) | 2.7%2 |
| 21 | NRR needed for plan, central case (solved roll-forward, rows 38-52) | 114.4%3 |
| 22 | Quarters with consolidated NRR at or above the central need, FY2020-FY2025 | 1 |
| 23 | Quarters disclosed, FY2020-FY2025 | 24 |
| 24 | Alternative A: FY2025 new-logo rate on pre-acquisition base (% of starting ARR) | 4.7% |
| 25 | Alternative A: NRR needed (new logos scale with the larger base) | 111.7%4 |
| 26 | Alternative B: FY2022-FY2025 average new-logo rate (% of starting ARR) | 8.7% |
| 27 | Alternative B: NRR needed | 107.8% |
- 1A lower bound: year-end ARR runs ahead of full-year revenue
- 2First year only: a flat $22.3M is a falling share as ARR grows
- 3Central case: about 114.4% NRR every year, solved over five years. Reached in 1 of 24 quarters
- 4Alternative: assumes new logos grow with the larger base, about $39.5M a year
| B | C | D | E | F | G | H | |
|---|---|---|---|---|---|---|---|
| 48 | Fiscal year | 2025 | 2026E | 2027E | 2028E | 2029E | 2030E |
| 49 | ARR, central roll-forward ($m) | 841.0 | 984.8 | 1,149.3 | 1,337.7 | 1,553.3 | 1,800.01 |
| 50 | of which new-logo ARR added ($m) | 22.3 | 22.3 | 22.3 | 22.3 | 22.3 | |
| 51 | Growth | 17.1% | 16.7% | 16.4% | 16.1% | 15.9% | |
| 52 | Check: FY2030 ARR less target ($m) | – |
- 1Reaches the plan's $1,800M in 2030
| B | C | D | E | F | G | |
|---|---|---|---|---|---|---|
| 30 | NRR case (rows) x new-logo assumption (columns) | NRR | $22.3 | 4.7% | 8.7% | Gap: central |
| 31 | Q1 2026 consolidated (after signing) | 108% | 10.2% | 12.7% | 16.7% | (6.2%) |
| 32 | Q4 2025 consolidated | 109% | 11.2% | 13.7% | 17.7% | (5.3%)1 |
| 33 | Q4 2025 excl. acquired entities | 113% | 15.0% | 17.7% | 21.7% | (1.4%)2 |
| 34 | Company target | 115% | 17.0% | 19.7% | 23.7% | 0.5%3 |
| 35 | Peak, Q4 2024 | 116% | 17.9% | 20.7% | 24.7% | 1.5% |
- 1Blended NRR in the central case falls 5.3 points a year short of the plan
- 2Even the core business's 113% falls 1.4 points short
- 3The company's 115% target clears it by 0.5 points
At $8.4B, the buyers paid 10.0x year-end ARR. In the central case, blended NRR of 109% plus $22.3M of new logos a year gives ARR growth of about 11.2% a year over five years, short of the 16.4% the plan needs. Closing the gap takes NRR of about 114.4% in every year to 2030. Clearwater’s consolidated NRR reached that in only 1 of 24 quarters, the 116% peak at the end of 2024. Even the core business’s 113% falls 1.4 points a year short, and the company’s own 115% target clears it by only 0.5 points. Two labelled alternatives assume faster new-client growth, so they need less. If new-logo ARR grew with the larger base, at 2025’s 4.7% of starting ARR, the plan would need about 111.7%. If it returned to the 2022 to 2025 average of 8.7%, about 107.8%. The first quarter after signing moved the wrong way: GRR slipped to 97% and NRR to 108% in Q1 2026.
Gross retention holds
98%
Core against blended NRR
113%
Estimated new-logo ARR
$22.3M
NRR the plan needs
114.4%
Takeaway: retention protects the base, but at $24.55 the price pays for NRR held near its single best quarter, or a new-logo recovery, that the record has not yet shown. The valuation modeling page sets the same price against the bankers’ ranges.
Compound put the four findings on one page, each with how it bears on the price.
FAQ
How do you calculate net revenue retention?
Take the ARR of the customers you had twelve months ago, measure their ARR today, including expansion, price increases, downgrades and churn, and divide by their ARR twelve months ago. New customers are left out. Clearwater’s NRR follows this pattern on ARR, and because part of its fees depend on clients’ assets, it also moves with markets. Check each company’s definition before comparing two NRR figures.
What is the difference between gross and net revenue retention?
Gross revenue retention counts only what is lost, so it can never exceed 100%. Net revenue retention adds expansion from the same customers, so it can. The gap between them is net expansion. At Clearwater, GRR held at 98% while NRR ranged from 103% to 116%, so expansion explains almost all of the movement. Some companies count downgrades in GRR. Clearwater counts only full terminations.
What is a good NRR for a SaaS business?
It depends on the customer. Software sold to large enterprises often runs NRR above 110%, and software sold to small businesses often runs below 100%. For a buyer, the level matters less than what the price needs: here management’s plan needs about 114.4% a year if new-client ARR stays at 2025’s dollar level, against a record of 109% blended and 113% for the core business.
How do you build a cohort analysis without customer-level data?
Use the disclosed rates. Build an ARR bridge from starting ARR, GRR and NRR, take new-client ARR as the remainder to ending ARR, and track each year’s base forward at the disclosed NRR. Label churn, expansion and new logos as estimates, and check whether GRR and NRR are measured on the same base. Say plainly that the cohorts are derived: every vintage retains at the company-wide rate, so the view shows how the base compounds, not how vintages differ. With customer-level billing in a data room, build true cohorts by signing year instead.
What is an ARR bridge?
An ARR bridge, or ARR waterfall, walks starting ARR to ending ARR through churn, expansion, new customers and acquisitions. It shows where growth comes from. Built from disclosed rates, as here, its middle lines are estimates. Clearwater’s 2025 bridge shows organic ARR growth of 17.7%, an estimated 73.5% of it from existing clients, and $282.0M of acquired ARR on top.
Can Compound build cohort and retention analysis from filings or a data room?
Yes. Compound reads 10-Ks, 10-Qs, earnings call transcripts and proxies, quotes the retention definitions and builds the ARR bridge in Excel, with every figure cited to its document and page. With customer-level data from a data room, it builds true cohort tables, logo churn and NRR by segment as live formulas you can audit and extend.