| B | C | D | E | F | G | H | |
|---|---|---|---|---|---|---|---|
| 6 | 2025E | 2026E | 2027E | 2028E | 2029E | 2030E | |
| 10 | Revenue – pro forma basis | 816 | 940 | 1,100 | 1,298 | 1,531 | 1,807 |
| 12 | SAM | 11,809 | 12,518 | 13,270 | 14,066 | 14,910 | 15,805 |
| 14 | Plan share of SAM | 6.9% | 7.5% | 8.3% | 9.2% | 10.3% | 11.4%1 |
| 17 | SOM path | 816 | 931 | 1,057 | 1,195 | 1,345 | 1,510 |
| 18 | Plan less SOM | 0 | 9 | 43 | 103 | 186 | 2972 |
- 1The plan's share of SAM rises by two-thirds in five years.
- 2$297M short of the plan at the pace Clearwater has managed.
Permira and Warburg Pincus agreed on December 20, 2025 to take Clearwater Analytics (NYSE: CWAN) private at $24.55 a share, $8.4 billion of enterprise value. Clearwater sells investment accounting, reporting and, since buying Enfusion in April 2025, front-office software to insurers, asset managers, corporate treasuries and hedge funds. Management’s projections in the merger proxy grow revenue from $730 million in 2025 to $1,807 million in 2030. That is 19.9% a year as reported, and 17.2% a year from the $816 million pro forma base that counts Enfusion for all of 2025. This page sizes the market that plan grows in and works out how much of it the plan needs. Every figure comes from one Compound run on the public filings, cited to the page.
What is market size? It is the annual revenue customers spend, or could spend, on what a company sells. TAM, SAM and SOM are its three layers. TAM (total addressable market) is the revenue available if every potential customer bought. SAM (serviceable addressable market) is the part the company’s current products, segments and geographies can serve. SOM (serviceable obtainable market) is the part it can realistically win in the plan period. Market sizing estimates them bottom-up, as customers times spend per customer, or top-down, as what the industry already spends, and a sound sizing does both and explains the gap. Who wins the market is covered on industry research.
Clearwater’s TAM: every market size management has claimed
Before you build anything, find out what the company has already said, where, and on what definition. The claim is the hypothesis you test.
| B | C | D | E | F | G | I | J | |
|---|---|---|---|---|---|---|---|---|
| 6 | Date | Source | Page | Scope | TAM | Core TAM | Increment | Insurance |
| 7 | 27-Sep-21 | IPO prospectus (424B4) | 14, 117, 126 | Global; core = NA + Europe insurers, AM, corporates | 10.0 | 4.7 | 1.3 | |
| 12 | 3-Mar-23 | 10-K FY2022 | 16 | Penetration and geography only2 | ||||
| 14 | 12-Jun-23 | Morgan Stanley Financials Conference | Transcript | Core = 80% win-rate segments; total incl. adjacent, APAC | 11.0 | 5.9 | 1.6 | |
| 18 | 13-Jan-25 | Enfusion acquisition release | 2 | Adds hedge funds | 1.9 | |||
| 21 | 3-Sep-25 | Investor Day 2025 | 9, 15 | Front-to-back lifecycle; incl. Asia, hedge funds | 23.3 | 6.31 | ||
| 22 | 5-Nov-25 | Q3 2025 earnings call | 2 | Balanced across geographies and markets | 23.0 | |||
| 23 | 18-Feb-26 | 10-K FY2025 | 11, 19, 21 | Spend; AM, insurance, hedge funds named | 23.0 | 6.0 |
- 1Insurance went from $1.3B at the IPO to $6.3B, 4.8x, while US insurers' invested assets grew 4.9% a year.
- 2This 10-K restated North American insurer penetration from 19% to 31%. No 10-K before FY2025 states a dollar TAM.
The claimed market grew 2.3 times in four years, from $10 billion to $23 billion. About a fifth of that is the market growing. The rest is a wider definition: the front office through Enfusion, hedge funds, Asia and a bigger insurance wallet. No 10-K before the year of the sale states a dollar TAM at all. Compared like for like, Compound’s build below is larger than management’s on both layers. Its $53.7 billion TAM is 2.3 times the $23 billion. Its $11.8 billion SAM is twice the $5.9 billion core market management last gave, in February 2025, for the segments where it says it wins about 80% of the time, partly because the SAM counts hedge funds and Asia. So the market is not the constraint on the plan. Share is.
The next step is to build the market from what Clearwater actually sells, at the price it actually charges.
How to calculate TAM, SAM and SOM bottom-up
Bottom-up market sizing counts customers and prices them. Clearwater’s 10-K for 2025 gives its revenue mix by segment and the client assets on its platform, so Compound worked out the price it realizes: about 0.6 basis points on client assets in every segment. The IPO prospectus implies the same rate, since its $10 billion TAM is about 0.6 basis points on the $158 trillion of assets it counted. The universe of client assets comes from the IPO prospectus, rolled forward to 2025 at each segment’s growth: SEC advisers’ assets for asset managers, NAIC data for insurers. Hedge funds are priced per client at Enfusion’s revenue per client, about $247,000, because Enfusion does not charge on assets.
SAM is today’s products at today’s price, in the segments Clearwater wins. TAM is four times today’s price in every segment, including pensions, sovereign funds and large banks that Clearwater does not yet win. The multiple is management’s own, from its remarks at investor conferences in 2024 and 2025: a client spends about 4 basis points across the investment lifecycle, against about 1 basis point on accounting. That prices TAM at about 2.4 basis points, four times the 0.6 Clearwater realizes. Hedge funds stay at today’s price, because Enfusion already sells them front to back.
| B | C | D | F | I | J | K | |
|---|---|---|---|---|---|---|---|
| 78 | Segment | Clients (#) | Assets ($tn) | Price (bps) | SAM ($m) | Wallet (x) | TAM ($m) |
| 79 | Insurers (US + Europe) | 3,693 | 31.6 | 0.60 | 1,894 | 4.0x1 | 7,575 |
| 80 | Asset managers ≥ $1bn (US + Europe) | 8,948 | 99.3 | 0.59 | 5,8922 | 4.0x | 23,567 |
| 81 | Corporates (US + Europe) | 1,667 | 4.1 | 0.56 | 229 | 4.0x | 916 |
| 82 | APAC – insurers, AM, corporates | n.a. | 28.5 | 0.59 | 1,677 | 4.0x | 6,708 |
| 83 | Banks – community (US) | 4,046 | 0.5 | 0.56 | 29 | 4.0x | 117 |
| 84 | Banks – other FDIC-insured (US) | 441 | 5.2 | 0.56 | 0 | 4.0x | 1,160 |
| 85 | Other asset owners & alternatives | n.a. | 51.8 | 0.56 | 03 | 4.0x | 11,522 |
| 86 | Hedge funds (global, via Enfusion) | 8,464 | 5.0 | 4.14 | 2,088 | 1.0x4 | 2,088 |
| 87 | Total | 27,259 | 226.2 | 11,8095 | 53,654 |
- 1The 4 bps lifecycle wallet over the 1 bp accounting spend, both from management's conference remarks.
- 2One price for every manager overstates the largest ones, which run Aladdin or build in-house.
- 3Pensions, sovereign funds and PE: Clearwater does not yet win here, so they are TAM only.
- 4Priced per client at $247k, not on assets, and not multiplied: Enfusion already sells front to back.
- 5Clearwater's $816M of 2025 pro forma revenue is 6.9% of it.
The TAM SAM SOM example in one line each:
- TAM: $53.7 billion, four times today’s price in every segment, hedge funds at today’s, and 2.3 times the $23 billion management claims.
- SAM: $11.8 billion, today’s products at today’s price, 22% of TAM, and twice the $5.9 billion core market management gave in February 2025.
- Revenue today: $816 million, 6.9% of SAM. SOM is $1.51 billion in 2030 if Clearwater keeps gaining share at its past pace.
TAM, SAM and SOM for Clearwater
Annual spend, billions of dollars, 2025E unless noted
Source: Compound's Bottom-up and Plan test tabs; Q3 2025 earnings call p.2; DEFM14A pp. 68–69.
A bottom-up build is only as good as its client count and its price, so the next step checks it from the other direction.
Top-down vs bottom-up market sizing: what rivals already bill
Top-down starts from what the market spends today. Compound read the segment disclosures of the listed vendors Clearwater meets: BlackRock’s Aladdin, SS&C, State Street’s Charles River and Alpha, FIS, SimCorp, Enfusion and Clearwater itself. It split each into a core line, software that does what Clearwater does, and a broad line that adds services such as fund administration.
| B | C | H | I | J | |
|---|---|---|---|---|---|
| 6 | Company | Business line | FY24A | Core | Broad |
| 7 | BlackRock | Aladdin – technology services | 1,603 | 1 | 1 |
| 8 | SS&C | Wealth & Investment Technologies | 1,460 | 1 | 1 |
| 9 | SS&C | GlobeOp – fund administration | 1,570 | 0 | 1 |
| 15 | State Street | Front office software & data (CRD, Alpha) | 639 | 1 | 1 |
| 16 | State Street | Middle office services | 383 | 0 | 1 |
| 17 | State Street | Back office services (custody-bundled) | 4,633 | 0 | 0 |
| 18 | FIS | Capital Market Solutions | 2,9791 | 0 | 1 |
| 20 | SimCorp (Deutsche Börse) | Software solutions ARR ($m) | 657 | 1 | 1 |
| 21 | Enfusion | ARR, YE2024 | 211 | 1 | 1 |
| 22 | Clearwater | Revenue | 452 | 1 | 1 |
| 23 | Vendor pool | Core – software lines | 5,021 | ||
| 24 | Vendor pool | Broad – incl. services, CMS | 9,953 | ||
| 26 | Vendor pool | Broad, 2025E | 10,7982 |
- 1Includes trading and treasury systems outside the buy side.
- 2Roughly the size of the $11.8B bottom-up SAM, on a broader definition, and 20% of TAM.
The two views meet near SAM and part at TAM. Listed vendors bill about $10.8 billion in Clearwater’s segments, roughly the size of the $11.8 billion bottom-up SAM on a broader definition, and their core software lines alone come to 47% of SAM. So the serviceable market is largely bought already, and Clearwater grows by taking clients from incumbents. The 80% of TAM that no listed vendor bills sits in in-house systems, vendors with no segment disclosure, such as Bloomberg AIM, SEI and Arcesium, and accounting bundled into custody fees. State Street’s back-office fees alone are $4.6 billion.
With the size settled, the question is how fast it grows and how much of the plan growth alone delivers.
Market growth vs market share: what the plan needs
Market share is the company’s revenue over the market’s. SAM grows about 6.0% a year with client assets. The plan grows pro forma revenue 17.2% a year, so the difference has to come from share. Compound put that share on a line, year by year, against Clearwater’s own history.
Clearwater's share of SAM: history, the plan and the SOM path
Revenue over serviceable market. 2020-2024 on core SAM excluding hedge funds, 2025E onward including Enfusion
Source: Compound's Plan test tab; DEFM14A pp. 68–69; Clearwater revenue from the IPO prospectus and Q4 releases. The step into 2025E is the Enfusion acquisition.
From 2020 to 2024 Clearwater gained about 0.53 points of share a year, and its revenue grew 22.1% a year, against about 6% a year for its market. The plan needs 0.90 points a year, 1.7 times as many. Compound measures the plan in points because a point of SAM is revenue taken from incumbents. In 2020 to 2024 that was about $45 million a year, on a core SAM of $7 billion to $9 billion. The plan needs nearly $130 million a year, on a SAM of $12.5 billion to $15.8 billion.
In growth terms the plan, at 17.2% a year, is slower than 2020 to 2024, at 22.1%, and its share grows about 10.6% a year against 15%. The ask is that the same displacement rate hold on a base twice the size, from a company whose pro forma revenue growth, in PJT’s preliminary deck, already slowed to 15.4% in 2025. Put the other way, at the old pace of share gain the market would have to grow 9.9% a year instead of 6.0%.
0.90 pts
Share of SAM the plan adds each year, against 0.53 in 2020-2024 on a market half the size
$1,510M
2030E revenue at the past pace of share gain (SOM), against the plan's $1,807M
9.9%
Market growth the plan needs at the past pace, against 6.0%
This page tests the plan, which is what the buyers underwrote. What the $24.55 price itself needs depends on how the DCF treats stock pay and tax attributes, so it is worked backwards on the DCF model page.
The plan needs more share points a year than history
1.7x
The plan sits above the SOM path
$297M
The market is big enough
$11.8B
TAM SAM SOM slide: one sizing, every format
The workbook is the source, and the slide and memo are drawn from it, so a changed input flows through instead of being retyped. This is the slide from the same run.
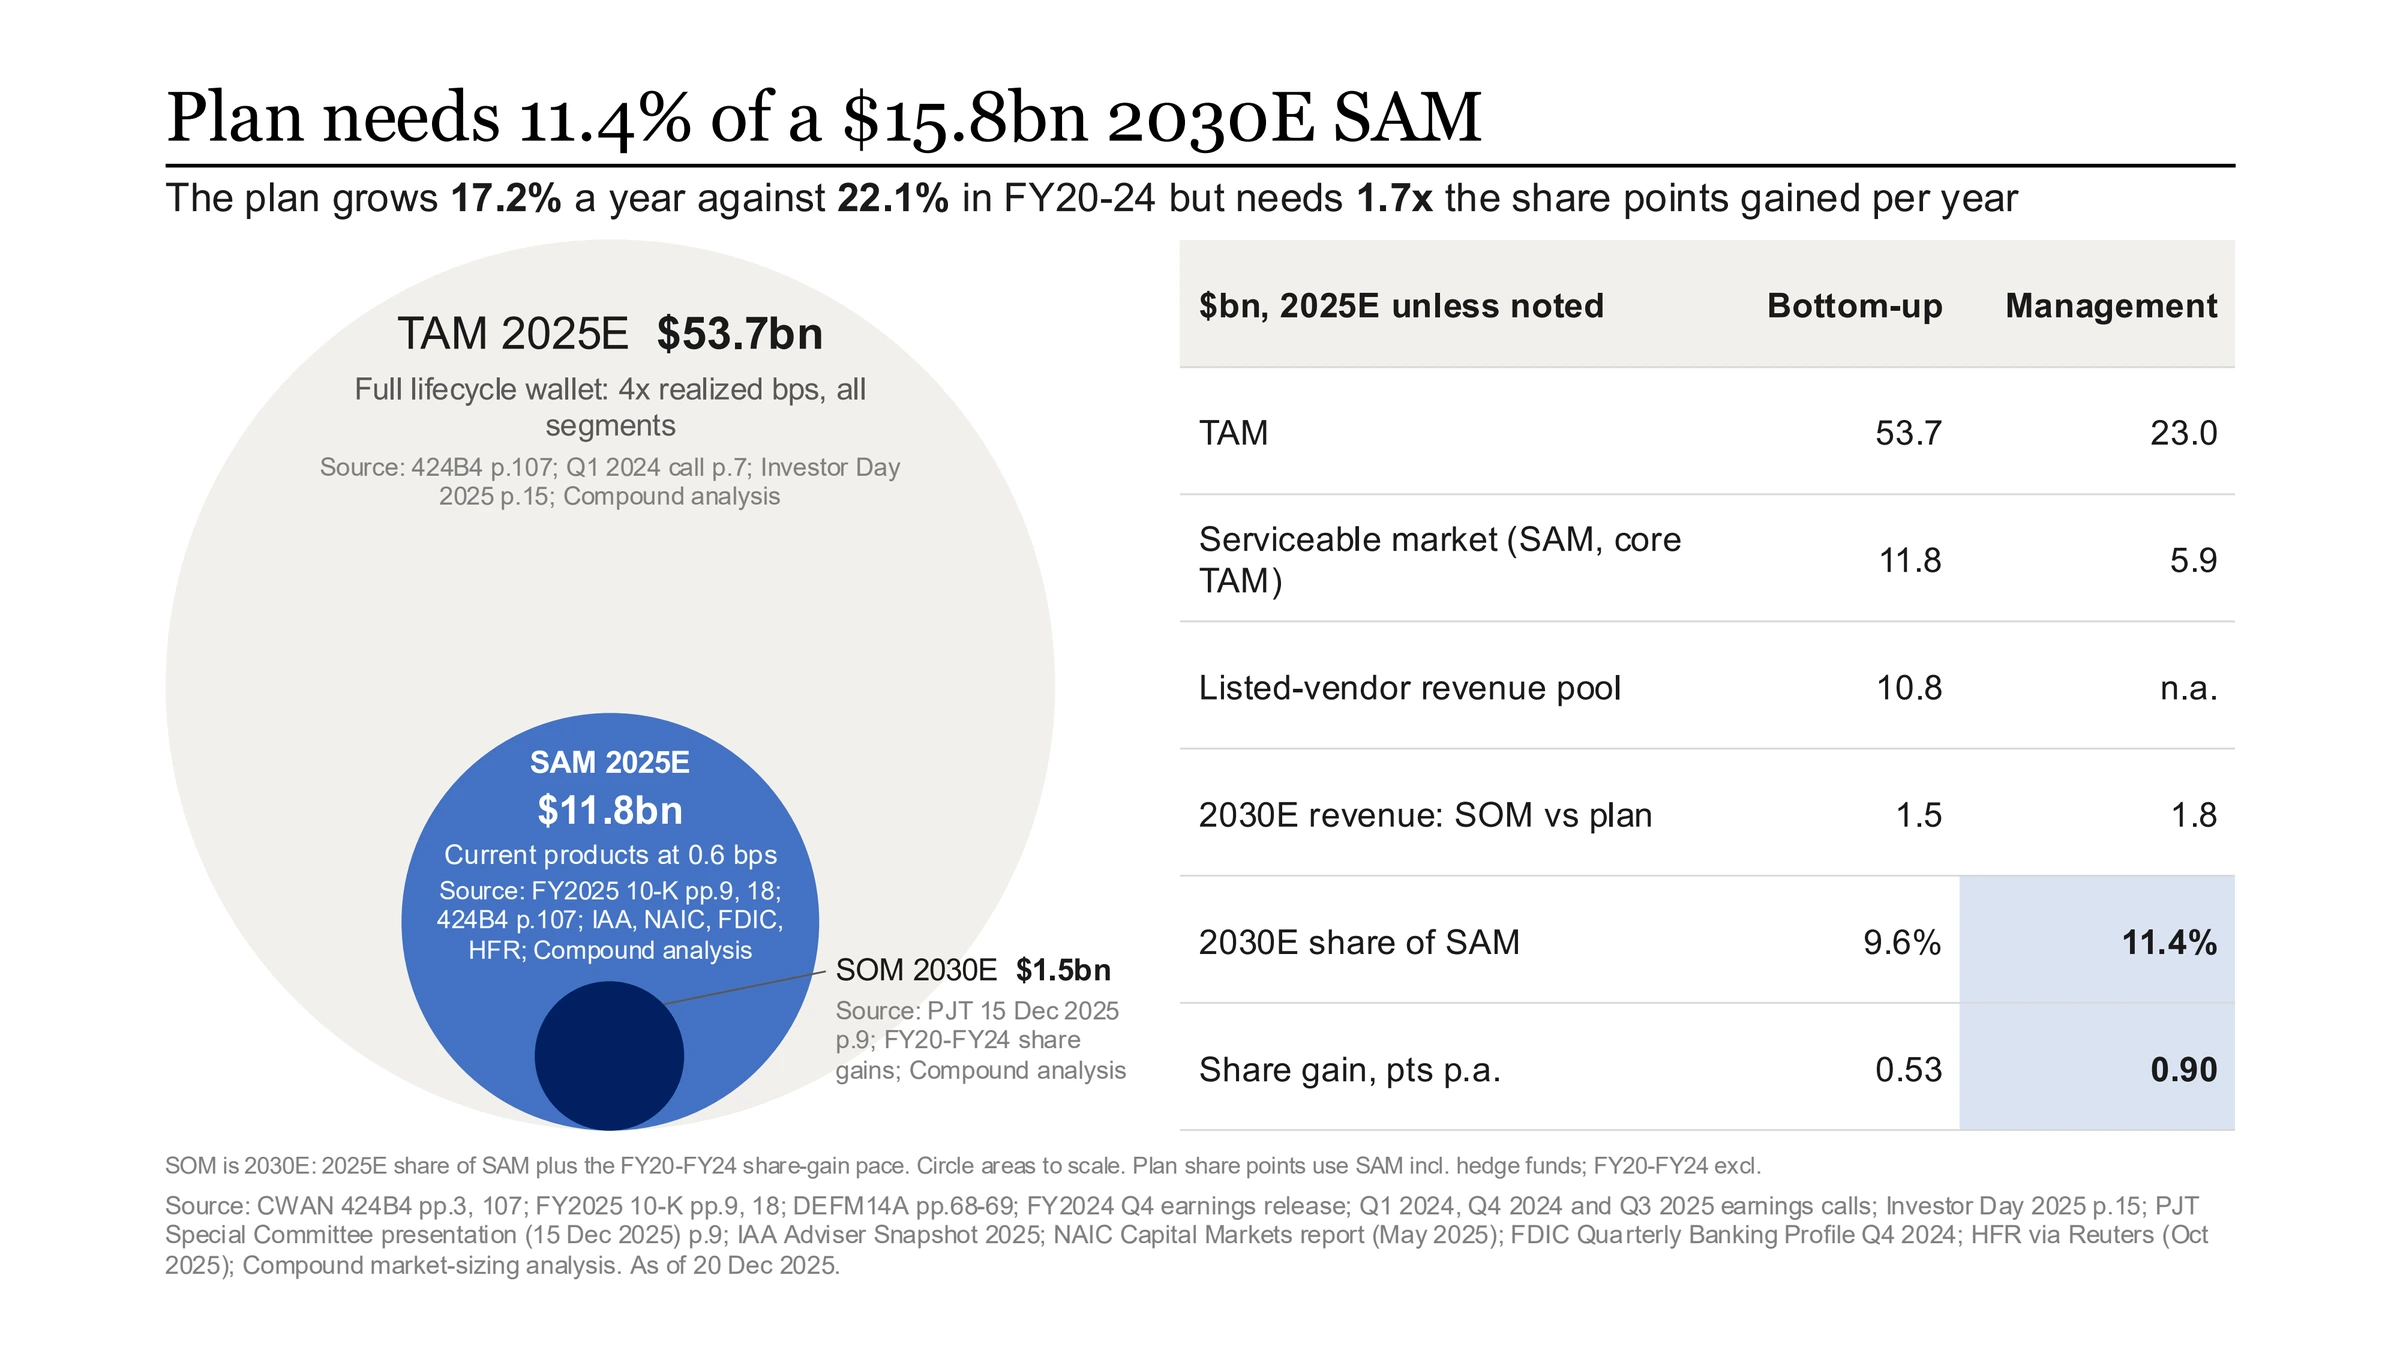
The TAM SAM SOM table behind it, as text:
| Layer | Size | What it counts | Source |
|---|---|---|---|
| TAM | $53.7B | Four times today’s price in every segment, from management’s 4 bps lifecycle wallet | Bottom-up build; management’s wallet comments |
| TAM, management | $23.0B | Front-to-back, incl. Asia and hedge funds | Q3 2025 earnings call |
| SAM | $11.8B | Today’s products at 0.6 bps, segments Clearwater wins | 10-K FY2025; IPO prospectus; bottom-up build |
| Core market, management | $5.9B | Segments where Clearwater says it wins about 80% of the time | Q4 2024 earnings call |
| Revenue today | $0.8B | 6.9% of SAM, 2025E pro forma | PJT preliminary deck p.9 |
| SOM, 2030E | $1.5B | 9.6% of SAM at the past pace of share gain | Plan test |
| Plan, 2030E | $1.8B | 11.4% of SAM | DEFM14A pp. 68–69 |
What the market sizing says about the deal
Clearwater’s market is big enough for the plan: $11.8 billion that its products serve today, inside a $53.7 billion TAM. The plan does not need a bigger market. It needs Clearwater to take about 0.9 points of share a year from Aladdin, SS&C, FIS and custody banks, 1.7 times the points it took as a fast-growing public company, on a market twice the size. In growth terms that is slower than its past, 17.2% a year against 22.1%, so the question is whether the same rate of displacement holds at scale. At the past pace, 2030 revenue is $1,510 million, $297 million short of plan, and the $8.4 billion enterprise value is 5.6 times that revenue. Diligence on this deal is diligence on displacement: win rates against incumbents, the time a new insurer takes to go live, and how much of Enfusion’s front office sells into the accounting base.
TAM, SAM and SOM workbook (Excel)Compound’s workbook from this run: every market size Clearwater claimed, the bottom-up build by segment, the vendor cross-check and the plan test, formulas intact and every input sourced. Replace the inputs with your company’s and the formulas carry through.Download · Free, no form One-page TAM, SAM and SOM slide (PowerPoint)Compound’s market sizing page for Clearwater: TAM, SAM and SOM with the bottom-up build against management’s figures, and what the plan needs.Download · Free, no form