| B | D | E | F | G | K | |
|---|---|---|---|---|---|---|
| 31 | Measure | Q1 FY26 | Covenant maximum | Headroom (x) | EBITDA decline before breach | Flag |
| 32 | Total net leverage, company basis | 6.55x | 7.50x | 0.95x | 12.6% | Amber |
| 33 | Total net leverage, credit agreement basis (our view) | 6.90x1 | 7.50x | 0.60x | 8.0% | Red |
| 34 | Net debt capacity left after PHX II draws to Dec-26, company basis | 95.5 | Amber | |||
| 35 | Net debt capacity left after PHX II draws to Dec-26, credit agreement basis | 7.02 | Red |
- 1Interest income and straight-line rent come out as the credit agreement defines EBITDA
- 2$127.7M of PHX II draws to December use all but $7.0M of the room at flat EBITDA
You are on the portfolio operations team at Halcyon Infrastructure Partners Fund IV, which owns 62.0% of Ironvale Digital Infrastructure, a US data center operator with 220 MW of commissioned capacity on six campuses. Ironvale is being sold, and the sponsor buyer closes on December 31, 2026. Until then, Ironvale is still Halcyon’s company, and the quarterly review is still Halcyon’s job.
The Q1 FY26 flash report has arrived, quarter ended March 31, 2026. Your job is the portfolio monitoring pack for the partners: a KPI dashboard against budget and prior year, the run-rate the rest of the year needs, covenant headroom under the credit agreement, and capex against plan. This page takes it one step at a time, each step run in Compound. The answer at the end: the quarter beat budget, but the construction draws planned to December would use almost all the covenant room on the lender’s definition.
Every EBITDA and net debt figure on this page is on management’s definition and the covenant basis at March 31, 2026, the basis the company reports to its owner and its lenders. A buyer’s diligence view is lower: see the financial due diligence example for $206.9M of FY25 buy-side adjusted EBITDA.
Ironvale Digital Infrastructure and Project Voltaic are fictional: the company and its data room are the open data room of PE Bench, published under CC-BY-4.0. Everything Compound produced on this page is real: the workbook and slide come from one Compound run on that room, quoted unedited apart from excerpts.
Portfolio company KPI dashboard: the quarter against budget and prior year
The first step puts every KPI the partners track on one scorecard, with actual, budget, prior year and a flag.
| B | C | D | E | F | H | K | |
|---|---|---|---|---|---|---|---|
| 14 | KPI | Unit | Q1 FY26 actual | Q1 FY26 budget | Var vs budget | Q1 FY25 | Flag |
| 15 | Total revenue | $M | 113.0 | 111.5 | 1.51 | 94.2 | Green |
| 16 | Lease & colocation revenue | $M | 82.9 | 81.6 | 1.3 | 72.5 | Green |
| 17 | Net operating income (NOI) | $M | 67.5 | 66.8 | 0.7 | 56.6 | Green |
| 19 | Adjusted EBITDA (management definition) | $M | 62.0 | 61.2 | 0.8 | 50.4 | Green |
| 21 | Power margin as booked (reimbursements less power cost) | $M | 0.02 | 0.0 | 0.0 | 0.0 | Red |
| 22 | Power cost not recovered, FY25 (interval data) | $M FY25 | (8.2)3 | Red | |||
| 23 | MW leased (period end) | MW | 202.2 | 201.0 | 1.2 | 194.14 | Green |
| 25 | Occupancy (period end) | % | 91.9% | 91.4% | 0.5% | 88.2% | Green |
| 26 | Churn, LTM (1 less MW-weighted retention) | % | 8.7% | 10.0% | (1.3%) | 9.6% | Green |
| 27 | Capex paid vs straight-line FY26 budget | $M | 75.7 | 108.8 | (33.1) | Amber | |
| 28 | PHX II FY26 spend: forecast vs FY26 budget | $M FY26 | 248.2 | 206.0 | 42.2 | Red |
- 1$0.4M of the $1.5M beat is metered power billed to tenants at cost, which earns no margin
- 2Zero by construction: the books record power cost equal to what tenants are billed, so this line cannot show leakage
- 3FY25 interval data put utility cost at $92.4M against $84.2M billed, 9.7% not recovered. Management reporting does not track it
- 4The flash report's prior-year column shows 188.6 MW and claims +13.6 MW of growth. The KPI dashboard and capacity bridge give 194.1 MW, so growth is +8.1 MW
Revenue was $113.0M, $1.5M over budget and 20.0% up on Q1 FY25. NOI and adjusted EBITDA each beat by under $1M, leased MW is 1.2 ahead and churn is running below plan. The red rows are the ones a flash report cannot show. Power margin reads zero every month because cost is booked equal to the reimbursements, and PHX II, the 60 MW Phoenix build, is spending ahead of its budget.
Compound also flagged two places where the flash report does not tie. Its prior-year MW conflicts with the company’s own KPI dashboard, and its $3.8M of other income is $0.5M below the $4.3M in the Q1 statements. Compound kept the reported $62.0M of adjusted EBITDA and listed the gap to reconcile.
Takeaway: Q1 is green on every income and leasing line, so the question is whether the rest of the year can stay that way.
Budget vs actual: the run-rate the rest of FY26 needs
The second step turns the quarter’s beat into the pace the full-year budget requires.
| B | T | |
|---|---|---|
| 35 | Item | Value |
| 36 | FY26 lease & colocation revenue budget | 361.0 |
| 37 | of which driver build at in-place rate | 317.5 |
| 38 | Bridge to plan above the driver build (commencement timing, straight-line and other) | 43.51 |
| 39 | Q1 FY26 lease revenue annualized (x 4) | 331.6 |
| 40 | Shortfall of the Q1 run-rate to the FY26 budget | (29.4) |
| 41 | Average lease revenue needed per quarter in Q2-Q4 FY26 | 92.72 |
- 1$43.5M of the budget is not in the company's own MW-times-rate build
- 2Q1 lease revenue was $82.9M. The plan needs about 12% more in each of the next three quarters
The beat was against a Q1 budget, not against the year. Q1 lease revenue of $82.9M annualizes to $331.6M, $29.4M short of the $361.0M FY26 budget. Leasing tells the same story. The budget ends FY26 at 232.0 MW leased, 29.8 MW more than at March 31, and 24.5 MW of that is PHX II. The last 18 MW of PHX II is only an LOI, at $118/kW a month, signed in May.
Takeaway: hitting FY26 depends on PHX II delivering and leasing on time, which makes the next question how PHX II is funded.
Covenant headroom: the company’s leverage and the lender’s
The third step recomputes the leverage covenant from the credit agreement’s own definitions, not the company’s.
| B | D | E | F | |
|---|---|---|---|---|
| 40 | Item | Q4 FY25 certified | Q1 FY26 company basis | Q1 FY26 credit agreement basis |
| 43 | Consolidated total debt | 1,570.0 | 1,635.0 | 1,635.0 |
| 46 | Unrestricted cash netted | 85.0 | 91.2 | 91.2 |
| 47 | Consolidated total net debt | 1,485.0 | 1,543.8 | 1,543.8 |
| 51 | LTM adjusted EBITDA (management definition) | 224.0 | 235.61 | 235.6 |
| 52 | less LTM interest income (definition adds back interest net of interest income) | (3.3)2 | ||
| 53 | less straight-line rent, FY25 (non-cash gain under clause (b)(i)) | (8.4) | ||
| 54 | less straight-line rent, Q1 FY26 | (2.2) | ||
| 56 | add back Q1 FY25 straight-line rent (estimated) | 2.1 | ||
| 57 | Consolidated EBITDA for the covenant | 224.0 | 235.6 | 223.8 |
| 58 | Total net leverage ratio | 6.63x | 6.55x | 6.90x |
| 59 | Maximum permitted | 7.50x | 7.50x | 7.50x |
| 60 | Headroom | 0.87x | 0.95x | 0.60x |
| 61 | EBITDA decline before breach | 11.6% | 12.6% | 8.0%3 |
| 62 | Additional net debt before breach, EBITDA held flat | 195.0 | 223.2 | 134.7 |
- 1Management definition: FY25 $224.0M plus Q1 FY26 $62.0M less Q1 FY25 $50.4M
- 2The agreement's Consolidated EBITDA takes out interest income and non-cash straight-line rent. The company's figure keeps both
- 3On the agreement's definition, EBITDA can fall only 8.0% before the 7.50x covenant is breached
On the company’s basis, net debt of $1,543.8M on $235.6M of LTM adjusted EBITDA gives 6.55x, down from the certified 6.63x at Q4 FY25 and 0.95x inside the 7.50x maximum. Read as the credit agreement defines it, EBITDA is $223.8M and leverage is 6.90x. Q1 FY25 straight-line rent is not disclosed by quarter, so Compound estimated it at a quarter of the FY25 total and labeled that an assumption.
Takeaway: covenant room is 0.60x on the lender’s definition, not 0.95x, and the net debt about to be added comes from PHX II.
PHX II: a budget that leaves out the first quarter
The fourth step checks the largest project’s spend against its budget, its draw schedule and its contingency.
| B | D | |
|---|---|---|
| 19 | Project budget | 618.0 |
| 24 | PHX II spend in Q1 FY26 | 71.0 |
| 25 | Spent through 31-Mar-26 | 412.0 |
| 28 | Remaining spend to complete at 31-Mar-26 | 206.0 |
| 29 | FY26 budget for PHX II | 206.01 |
| 31 | Forecast cumulative spend at 31-Dec-26 | 589.2 |
| 32 | Forecast FY26 PHX II spend | 248.2 |
| 33 | Forecast FY26 spend over FY26 budget | 42.2 |
| 34 | Owner contingency remaining (overdrawn) | (1.8)2 |
| 35 | Disputed HVAC claim, outside the project budget | 4.63 |
| 37 | Forecast PHX II construction facility draws, Apr-26 to Dec-26 | 127.7 |
- 1The FY26 budget equals the spend left at March 31, so the $71.0M spent in Q1 is missing from it
- 2The May board deck calls contingency use within plan
- 3$1.2M of the claim is accrued
The $206.0M FY26 budget for PHX II is the cost left to complete at March 31, so it leaves out the $71.0M already spent in January to March. On the draw schedule, FY26 spend is $248.2M, $42.2M or 20.5% over budget. Owner contingency is $1.8M overdrawn, and a $4.6M disputed HVAC claim sits outside the budget. Total capex, by contrast, reads as timing. Q1 spend of $75.7M is 17.4% of the $435.2M FY26 budget, against 25% on a straight line.
Takeaway: PHX II’s FY26 cash need is $42.2M above budget, and $127.7M of it is still to be drawn on the construction facilities by December.
How much of the covenant room the PHX II draws use
The fifth step sets the debt room from the covenant against the draws already scheduled.
Net debt room before 7.50x against PHX II draws
Additional net debt allowed at flat EBITDA, and forecast PHX II facility draws April to December 2026
Source: Ironvale credit agreement Section 7.11, Q1 FY26 statements and PHX II draw schedule (fictional company, PE Bench). Covenant basis at March 31, 2026. Calculation by Compound, Capex & Covenant tab.
At flat EBITDA, the company’s basis leaves $95.5M of room after the PHX II draws. The credit agreement’s basis leaves $7.0M, and ATL II’s draws come on top of that. The plan stays compliant only if EBITDA grows as budgeted, and the budget already needs the steep second-half ramp from step two.
Takeaway: on the lender’s definition, PHX II alone would take Ironvale to within $7.0M of its covenant before the buyer closes, which is what the partners need to raise with management.
The quarterly portfolio review slide
The last step puts the quarter on one page for the partners, with the questions for management.
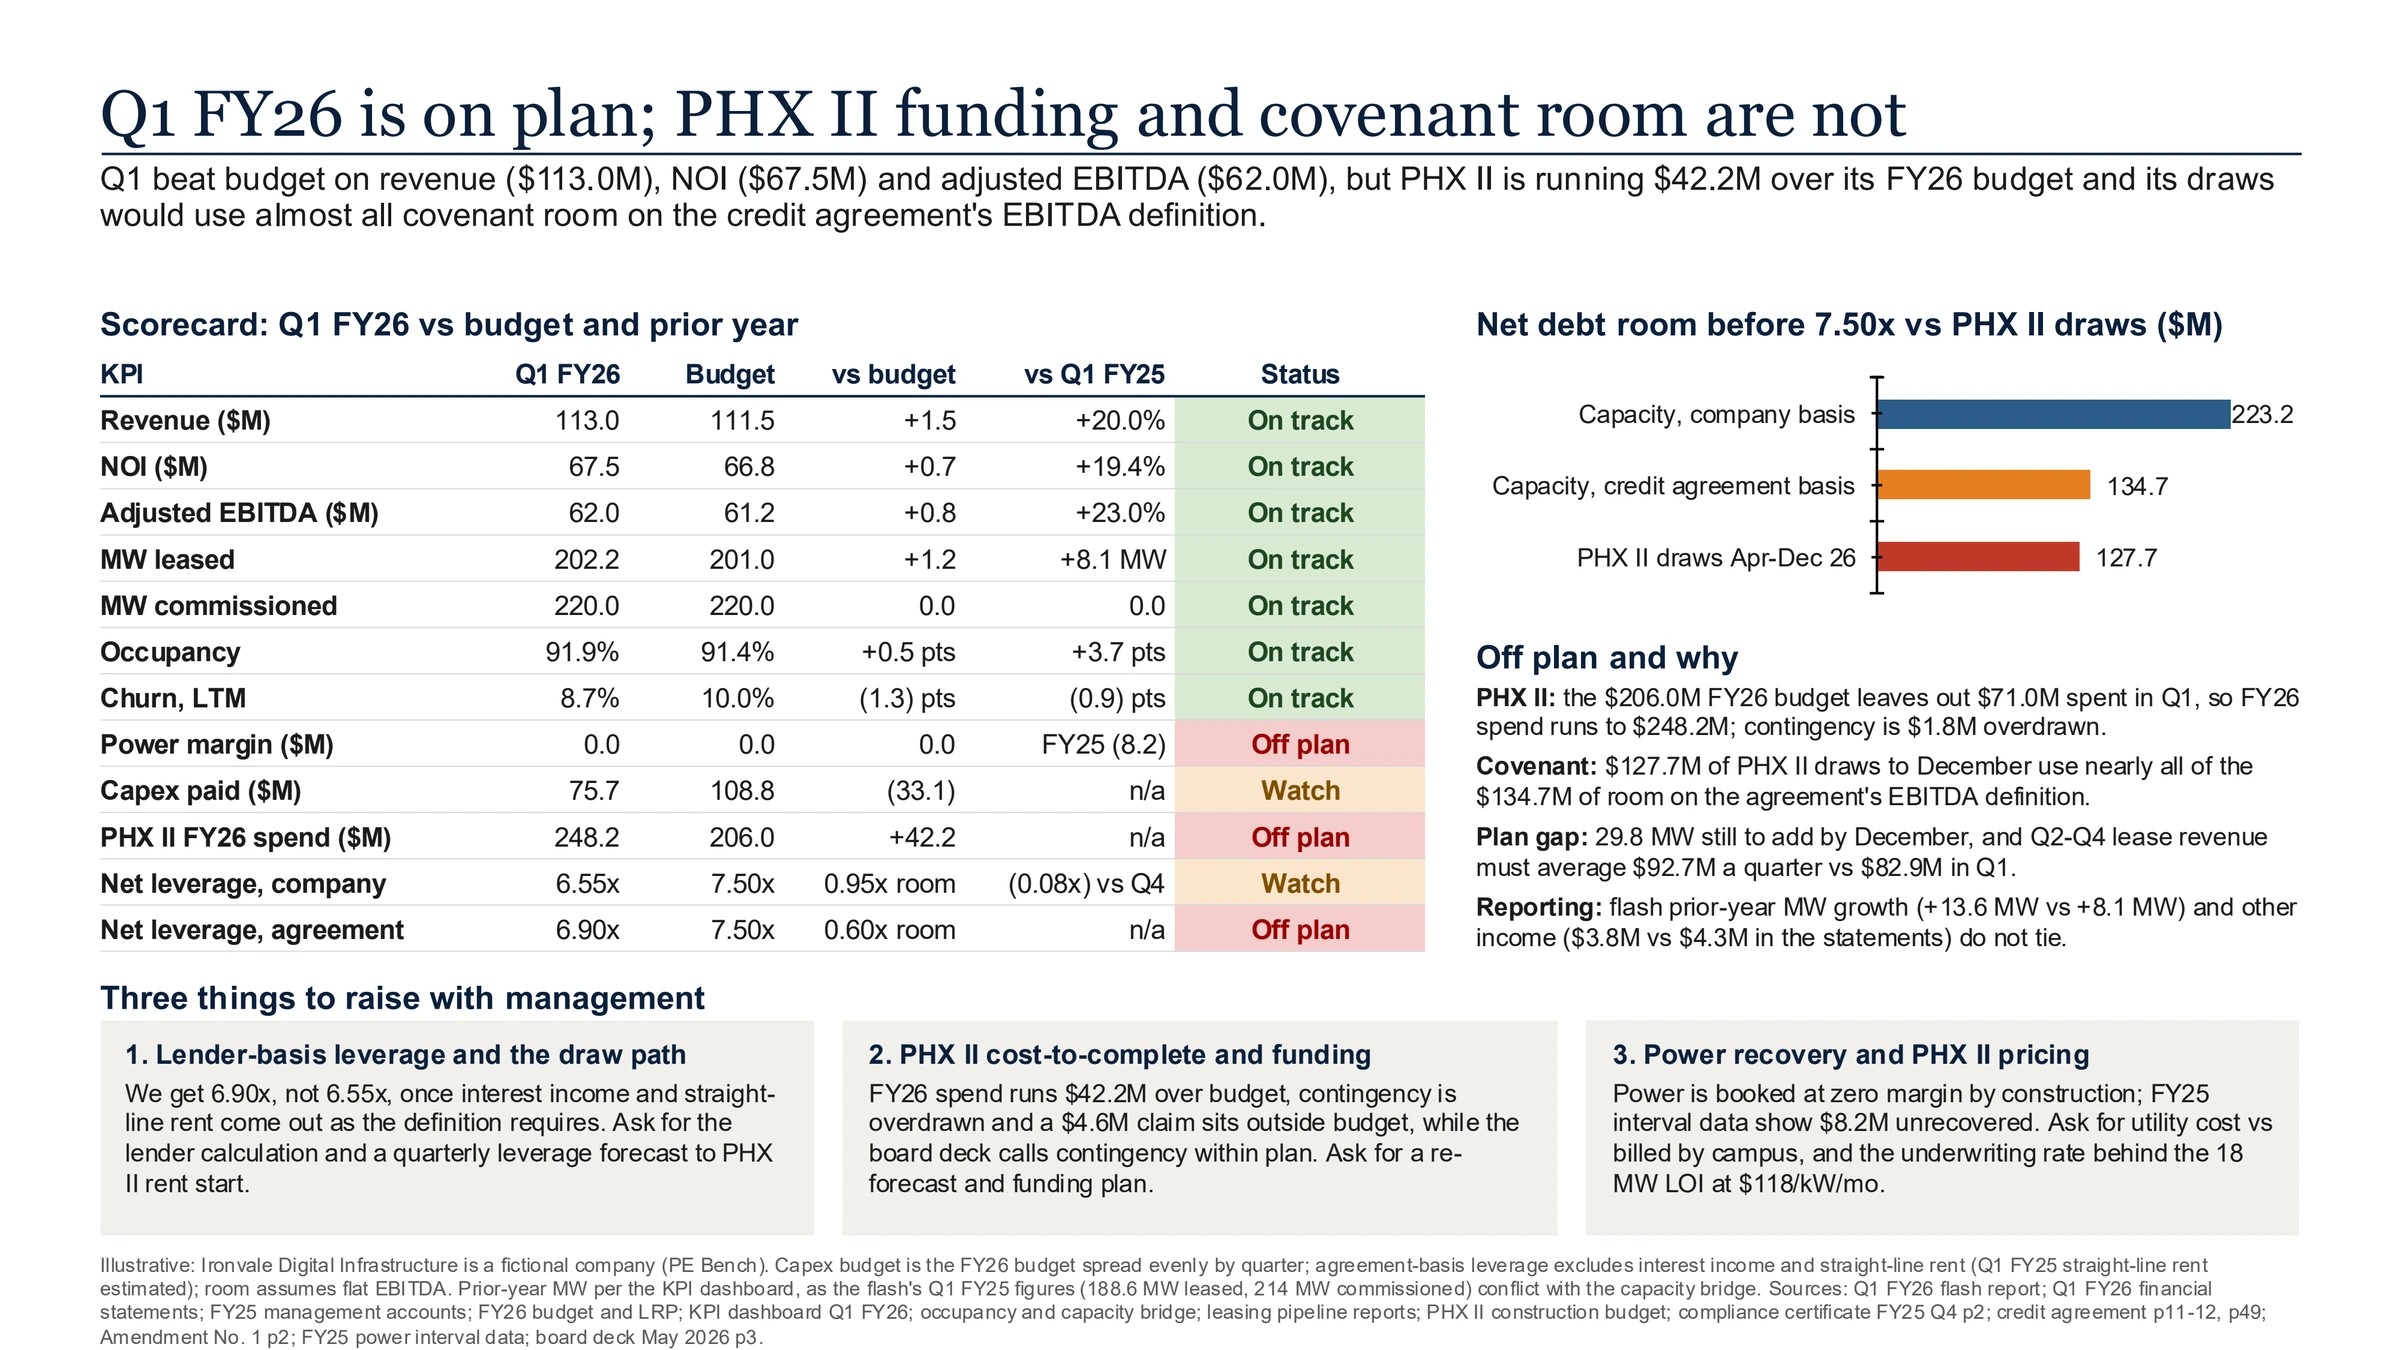
The three asks each name what would settle them:
- Lender-basis leverage: the company’s own covenant calculation and a quarterly leverage forecast up to the start of PHX II rent.
- PHX II: an updated cost-to-complete and funding plan, with the HVAC claim and the contingency overrun in it.
- Power and pricing: utility cost against amounts billed, by campus, and the underwriting rate behind the $118/kW LOI.
A seller’s monitoring pack is also what the buyer’s team will test in diligence, where the same earnings and net debt move from management’s basis to a buyer’s. The debt schedule example rolls a covenant forward year by year.
Takeaway: the slide tells the partners Q1 is on plan, and that the covenant and PHX II funding need management’s answers before the next draw.
Portfolio monitoring KPI dashboard (Excel)Compound’s workbook from this run, free and without a form: Dashboard with the scorecard, covenant block and flag thresholds, Monthly P&L against budget and prior year, Quarterly KPIs with the leasing gap and pipeline, and Capex & Covenant. Formulas are live and every input is cited. Use it as a portfolio monitoring template: replace the inputs with your company’s and the flags carry through.Download · Free, no form Quarterly portfolio review slide (PowerPoint)Compound’s one-page review for Ironvale Q1 FY26: the scorecard with status, covenant room against PHX II draws, what is off plan and three asks for management.Download · Free, no form